Author Archives: robot

RMX Tempo Adjust (Max for Live Utility)

I quickly coded a small utility for Ableton Live that allows mapping of controller buttons / keyboard keys to increment / decrement tempo. There are other ways to achieve this (e.g. https://www.ableton.com/en/articles/tempo-mapping-buttons/), however for those with M4L this seems easier and more flexible. It’s obviously not very generic, but can easily be modified to increment / decrement other live parameters in a similar way. Just drop it on an empty MIDI track and map the two buttons.

Download it for free here: http://www.maxforlive.com/library/device/2986/rmx-tempo-adjust

Measuring Variability of Mobility Patterns from Multiday Smart-card Data (JOCS 2015)

Journal: Journal of Computational Science

Authors: Chen Zhong, Ed Manley, Stefan Müller Arisona, Michael Batty, Gerhard Schmitt

Abstract: The availability of large amounts of mobility data has stimulated the research in discovering patterns and understanding regularities. Comparatively, less attention has been paid to the study of variability, which, however, has been argued as equally important as regularities, since variability identifies diversity. In a transport network, variability exists from person to person, from place to place, and from day to day. In this paper, we present a set of measuring of variability at individual and aggregated levels using multi-day smart-card data. Statistical analysis, correlation matrix and network-based clustering methods are applied and potential use of measured results for urban applications are also discussed. We take Singapore as a case study and use one-week smart-card data for analysis. An interesting finding is that though the number of trips and mobility patterns varies from day to day, the overall spatial structure of urban movement always remains the same throughout a week. This finding showed that a systemic framework with well-organized analytical methods is indeed, necessary for extracting variability that may change at different levels and consequently for uncovering different aspects of dynamics, namely transit, social and urban dynamics. We consider this paper as a tentative work toward such generic framework for measuring variability and it can be used as a reference for other research work in such a direction.

Title: Time-Space Diagram Revisited
Authors: Chen Zhong, Ed Manley, Stefan Müller Arisona, Michael Batty, Gerhard Schmitt
Journal: Journal of Computational Science
Publisher: Elsevier
Volume: 9
Year: 2015
Pages: 125 – 130
Link: http://dx.doi.org/10.1016/j.jocs.2015.04.021

Time–Space Diagram Revisited (TRR 2442)

Journal: Transportation Research Record: Journal of the Transportation Research Board.

Authors: Afian Anwar, Zeng Wei, Stefan Müller Arisona

Abstract: Widely used in the design and analysis of transportation systems, time-space diagrams were developed in an era of data scarcity, when it was necessary to obtain data by means of driver logs, human observ- ers, and aerial photographs. This paper shows how time-space diagrams remain relevant today, in an era of data abundance. An application efficiently encodes the trajectories of bus GPS data in a time-space cube and uses simple geometric methods to calculate and to visualize the headways and separation of buses on a bus route. These methods are discussed in detail. How they can be used as the basis of a software package that monitors performance measures for a variety of applications is explored.

Title: Time-Space Diagram Revisited
Authors: Afian Anwar, Wei Zeng, Stefan Müller Arisona
Journal: TRR
Publisher: TRB
Volume: 2442
Year: 2014
Pages: 1 – 7
Link: http://dx.doi.org/10.3141/2442-01

Visualizing Mobility of Public Transportation System (TVCG/VAST)

Journal: IEEE Transactions on Visualization and Computer Graphics (TVCG).

Conference: IEEE Visual Analytics Science and Technology (VAST) 2014.

Authors: Wei Zeng, Chi-Wing Fu, Stefan Müller Arisona, Alexander Erath, Huamin Qu

Abstract: Public transportation systems (PTSs) play an important role in modern cities, providing shared/massive transportation services that are essential for the general public. However, due to their increasing complexity, designing effective methods to visualize and explore PTS is highly challenging. Most existing techniques employ network visualization methods and focus on showing the network topology across stops while ignoring various mobility-related factors such as riding time, transfer time, waiting time, and round-the-clock patterns. This work aims to visualize and explore passenger mobility in a PTS with a family of analytical tasks based on inputs from transportation researchers. After exploring different design alternatives, we come up with an integrated solution with three visualization modules: isochrone map view for geographical information, isotime flow map view for effective temporal information comparison and manipulation, and OD-pair journey view for detailed visual analysis of mobility factors along routes between specific origin-destination pairs. The isotime flow map linearizes a flow map into a parallel isoline representation, maximizing the visualization of mobility information along the horizontal time axis while presenting clear and smooth pathways from origin to destinations. Moreover, we devise several interactive visual query methods for users to easily explore the dynamics of PTS mobility over space and time. Lastly, we also construct a PTS mobility model from millions of real passenger trajectories, and evaluate our visualization techniques with assorted case studies with the transportation researchers.

Title: Visualizing Mobility of Public Transportation System
Authors: Wei Zeng, Chi-Wing Fu, Stefan Müller Arisona, Alexander Erath, Huamin Qu
Journal: IEEE TVCG
Publisher: IEEE
Volume: 20(12)
Year: 2014
Pages: 1833 – 1842
Link: http://dx.doi.org/10.1109/TVCG.2014.2346893

Detecting the Dynamics of Urban Structure Through Spatial Network Analysis (IJGIS 2014)

Journal: International Journal of Geographical Information Science

Authors: Chen Zhong, Stefan Müller Arisona, Xianfeng Huang, Michael Batty, Gerhard Schmitt

Abstract: Urban spatial structure in large cities is becoming ever more complex as populations grow in size, engage in more travel, and have increasing amounts of disposable income that enable them to live more diverse lifestyles. These trends have prominent and visible effects on urban activity, and cities are becoming more polycentric in their structure as new clusters and hotspots emerge and coalesce in a wider sea of urban development. Here, we apply recent methods in network science and their generalization to spatial analysis to identify the spatial structure of city hubs, centers, and borders, which are essential elements in understanding urban interactions. We use a ‘big’ data set for Singapore from the automatic smart card fare collection system, which is available for sample periods in 2010, 2011, and 2012 to show how the changing roles and influences of local areas in the overall spatial structure of urban movement can be efficiently monitored from daily transportation.
In essence, we first construct a weighted directed graph from these travel records. Each node in the graph denotes an urban area, edges denote the possibility of travel between any two areas, and the weight of edges denotes the volume of travel, which is the number of trips made. We then make use of (a) the graph properties to obtain an overall view of travel demand, (b) graph centralities for detecting urban centers and hubs, and (c) graph community structures for uncovering socioeconomic clusters defined as neighborhoods and their borders. Finally, results of this network analysis are projected back onto geographical space to reveal the spatial structure of urban movements. The revealed community structure shows a clear subdivision into different areas that separate the population’s activity space into smaller neighborhoods. The generated borders are different from existing administrative ones. By comparing the results from 3 years of data, we find that Singapore, even from such a short time series, is developing rapidly towards a polycentric urban form, where new subcenters and communities are emerging largely in line with the city’s master plan.
To summarize, our approach yields important insights into urban phenomena generated by human movements. It represents a quantitative approach to urban analysis, which explicitly identifies ongoing urban transformations.

Title: Detecting the Dynamics of Urban Structure Through Spatial Network Analysis
Authors: Chen Zhong, Stefan Müller Arisona, Xianfeng Huang, Michael Batty, Gerhard Schmitt
Journal: International Journal of Geographical Information Science
Publisher: Taylor & Francis
Year: 2014
DOI: 10.1080/13658816.2014.914521
Link: http://www.tandfonline.com/doi/abs/10.1080/13658816.2014.914521#.U8P6N1bsd8E

A Visual Analytics Framework for Large Transportation Datasets (CAADRIA 2014)

Conference: 19th International Conference on Computer-Aided Architectural Design Research in Asia CAADRIA 2014

Authors: Chen Zhong, Stefan Müller Arisona, Gerhard Schmitt

Abstract: The advancement of sensor technologies makes it possible to collect large amounts of dynamic urban data. On the other hand, how to store, process, and analyze collected urban data to make them useful becomes a new challenge. To address this issue, this paper proposes a visual analytics framework, which is applied to transportation data to manage and extract information for urban studies. More specif- ically, the proposed framework has three components: (1) a geographic information system (GIS) based pipeline providing basic data processing functions; (2) a spatial network analysis that is integrated into the pipeline for extracting spatial structure of urban movement; (3) interactive operations allowing the user to explore and view the output data sets at different levels of details. Taking Singapore as a case study area, we use a sample data set from the automatic smart card fare collection system as an input to our prototype tool. The result shows the feasibility of proposed framework and analysis method. To summarize, our work shows the potential of geospatial based visual analytics tools in using ‘big’ data for urban analysis.

Award: Won best presentation award.

Title: A Visual Analytics Framework for Large Transportation Datasets
Authors: Chen Zhong, Stefan Müller Arisona, Gerhard Schmitt
Proceedings: 19th International Conference on Computer- Aided Architectural Design Research in Asia CAADRIA 2014
Publisher: The Association for Computer-Aided Architectural Design Research in Asia (CAADRIA)
Year: 2014
Pages: 223 – 232
Link: http://cumincad.scix.net/cgi-bin/works/Show?caadria2014_014

Journal of Professional Communication: “Art/Science Hybrids”

Special Issue on Art/Science Hybrids. Journal of Professional Communication (JPC), Volume 3, Issue 2, 2013
http://digitalcommons.mcmaster.ca/jpc/

A collection of papers originally presented at Digital Art Weeks 2013 Singapore (DAW)
http://www.digitalartweeks.ethz.ch/

Editor in chief: Alex Sévigny, McMaster University

Guest editors: Steve Gibson, Faculty of Art, Design and Social Science, Northumbria University, Newcastle, UK and Stefan Müller Arisona, University of Applied Sciences and Arts Northwestern Switzerland FHNW / Future Cities Laboratory, ETH Zurich

The rise of new transdisciplinary practices in the late 20th and early 21st Centuries is striking. The gulf between art and science that has widened since the Enlightenment has now been challenged by a wide body of scholars, artists, designers and scientists. This special issue explores the concerns of emergent transdisciplinary research that seeks to re-unite the arts and sciences.

Table of Contents

Editorials

Preface to the JPC special issue on Art/Science Hybrids. Alex Sévigny

Art Into science/science into art. Steve Gibson

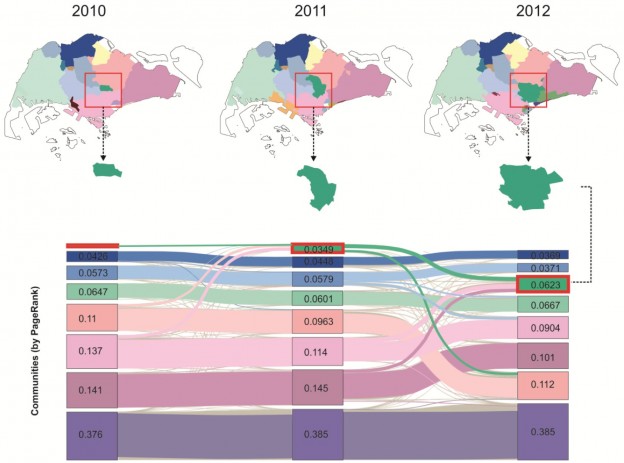
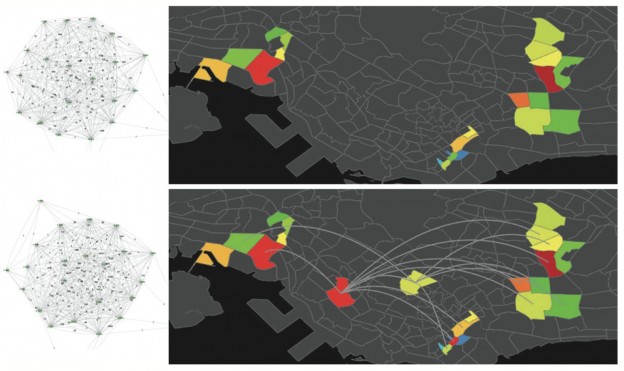
Iterative Emergence of Art/Science Hybrids. Stefan Müller Arisona, Pascal Mueller, Simon Schubiger, and Matthias Specht

Commentary

Augmenting science through art. Matthias Berger

Next nature: ‘nature caused by people’. Sue Thomas

Interview

Interview with George Legrady, chair of the media arts & technology program at the University of California, Santa Barbara. Stefan Müller Arisona

Research Articles

Art-science and verbal articulation in hyper-visual techno-culture. F. Scott Taylor

Theoretical aesthetics. Adam Tindale

Mapping art to systems thinking. Paul Goodfellow

The superhero and the DJ: Science meets design. Mikael Lindstrom, Farvash Razavi, and Nandi Novell

Social commentary through the transdisciplinary practice of audio-visual performance. Léon McCarthy

The digitization of music and the accessibility of the artist. Marius Carboni

Live programming for robotic fabrication. Jason Lim

Title: Art/Science Hybrids
Editor: Alex Sévigny
Guest Editors: Steve Gibson and Stefan Müller Arisona
Journal: Journal of Profession Communication
Year: 2013
Volume: 3(2)
Link: http://digitalcommons.mcmaster.ca/jpc/

Cinder Deferred Renderer

Cinder application for deferred rendering experiments (lighing, shadow mapping, SSAO), available on Github at https://github.com/arisona/cinder_deferred_renderer

Forked from original code by Anthony Scavarelli anthony.scavarelli@gmail.com at https://github.com/PlumCantaloupe/Cinder-Deferred-Renderer

Thanks to Anthony and the contributors his code is based on.

Original code ported to c++11 and optimized / fixed a couple of things, plus some new features/controls.

This code is based on a deferred renderer for point lights and screen space ambient occlusion (SSAO), including shadow mapping.

Lecture notes on Deferred Rendering and Shadows

In relation to above example code, the following lecture notes are available for download here:

Deferred Rendering (deferred_rendering_131113.pdf)
Shadow Rendering (shadow_rendering_131113.pdf)