
Tag: ETH Zurich
20 posts tagged with "ETH Zurich"
Visualizing Mobility of Public Transportation System (TVCG/VAST)
Journal: IEEE Transactions on Visualization and Computer Graphics (TVCG).
Conference: IEEE Visual Analytics Science and Technology (VAST) 2014.
Authors: Wei Zeng, Chi-Wing Fu, Stefan Arisona, Alexander Erath, Huamin Qu
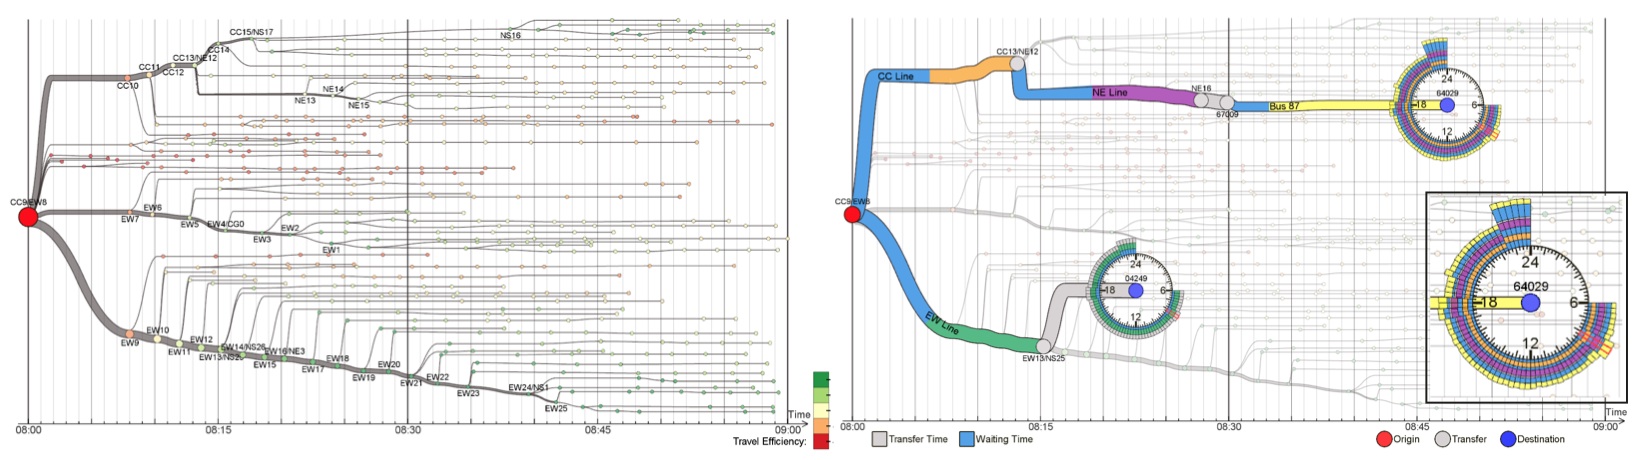
Abstract: Public transportation systems (PTSs) play an important role in modern cities, providing shared/massive transportation services that are essential for the general public. However, due to their increasing complexity, designing effective methods to visualize and explore PTS is highly challenging. Most existing techniques employ network visualization methods and focus on showing the network topology across stops while ignoring various mobility-related factors such as riding time, transfer time, waiting time, and round-the-clock patterns. This work aims to visualize and explore passenger mobility in a PTS with a family of analytical tasks based on inputs from transportation researchers. After exploring different design alternatives, we come up with an integrated solution with three visualization modules: isochrone map view for geographical information, isotime flow map view for effective temporal information comparison and manipulation, and OD-pair journey view for detailed visual analysis of mobility factors along routes between specific origin-destination pairs. The isotime flow map linearizes a flow map into a parallel isoline representation, maximizing the visualization of mobility information along the horizontal time axis while presenting clear and smooth pathways from origin to destinations. Moreover, we devise several interactive visual query methods for users to easily explore the dynamics of PTS mobility over space and time. Lastly, we also construct a PTS mobility model from millions of real passenger trajectories, and evaluate our visualization techniques with assorted case studies with the transportation researchers.
https://www.youtube.com/watch?v=Q95c8PpneT8
Title: Visualizing Mobility of Public Transportation System
Authors: Wei Zeng, Chi-Wing Fu, Stefan Arisona, Alexander Erath, Huamin Qu
Journal: IEEE TVCG
Publisher: IEEE
Volume: 20(12)
Year: 2014
Pages: 1833 - 1842
Link: https://dx.doi.org/10.1109/TVCG.2014.2346893
Detecting the Dynamics of Urban Structure Through Spatial Network Analysis (IJGIS 2014)
Journal: International Journal of Geographical Information Science
Authors: Chen Zhong, Stefan Arisona, Xianfeng Huang, Michael Batty, Gerhard Schmitt
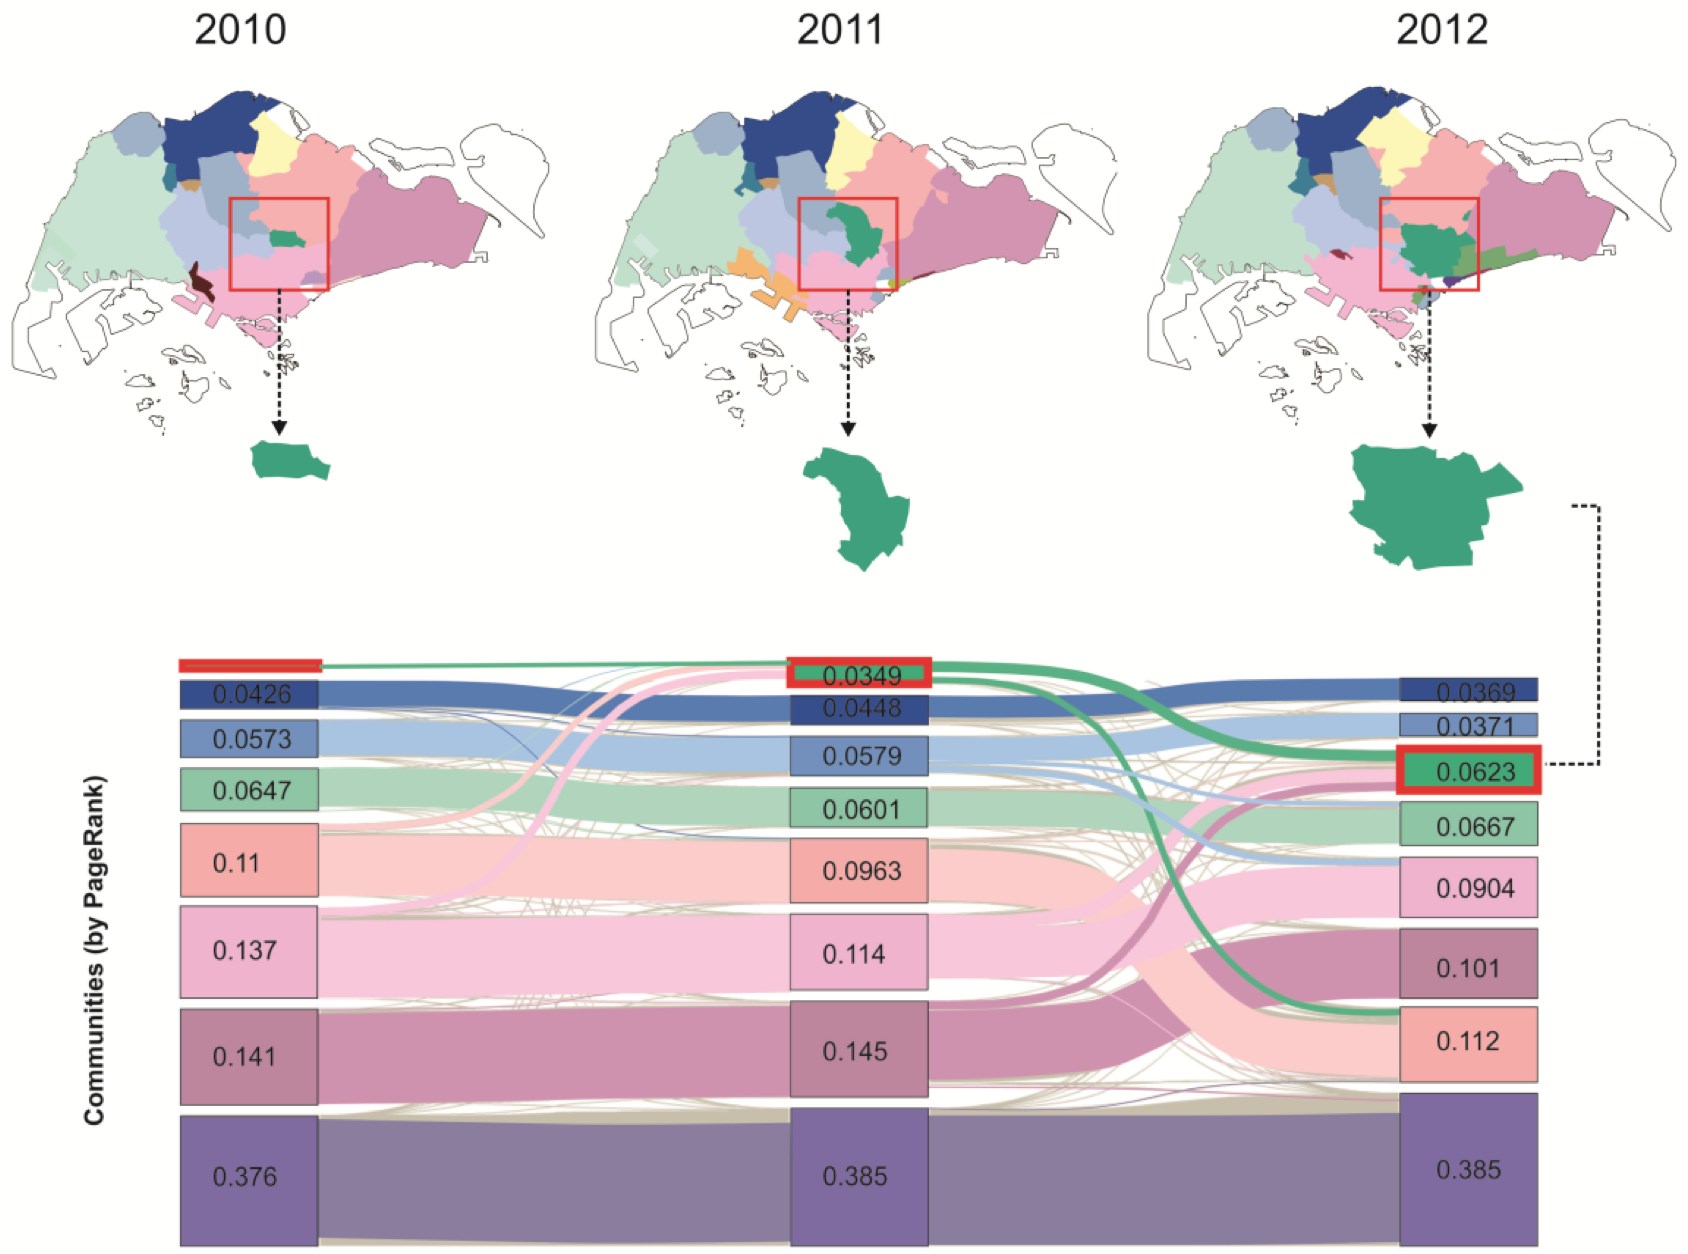
Abstract: Urban spatial structure in large cities is becoming ever more complex as populations grow in size, engage in more travel, and have increasing amounts of disposable income that enable them to live more diverse lifestyles. These trends have prominent and visible effects on urban activity, and cities are becoming more polycentric in their structure as new clusters and hotspots emerge and coalesce in a wider sea of urban development. Here, we apply recent methods in network science and their generalization to spatial analysis to identify the spatial structure of city hubs, centers, and borders, which are essential elements in understanding urban interactions. We use a ‘big’ data set for Singapore from the automatic smart card fare collection system, which is available for sample periods in 2010, 2011, and 2012 to show how the changing roles and influences of local areas in the overall spatial structure of urban movement can be efficiently monitored from daily transportation. In essence, we first construct a weighted directed graph from these travel records. Each node in the graph denotes an urban area, edges denote the possibility of travel between any two areas, and the weight of edges denotes the volume of travel, which is the number of trips made. We then make use of (a) the graph properties to obtain an overall view of travel demand, (b) graph centralities for detecting urban centers and hubs, and (c) graph community structures for uncovering socioeconomic clusters defined as neighborhoods and their borders. Finally, results of this network analysis are projected back onto geographical space to reveal the spatial structure of urban movements. The revealed community structure shows a clear subdivision into different areas that separate the population’s activity space into smaller neighborhoods. The generated borders are different from existing administrative ones. By comparing the results from 3 years of data, we find that Singapore, even from such a short time series, is developing rapidly towards a polycentric urban form, where new subcenters and communities are emerging largely in line with the city’s master plan. To summarize, our approach yields important insights into urban phenomena generated by human movements. It represents a quantitative approach to urban analysis, which explicitly identifies ongoing urban transformations.
Title: Detecting the Dynamics of Urban Structure Through Spatial Network Analysis
Authors: Chen Zhong, Stefan Arisona, Xianfeng Huang, Michael Batty, Gerhard Schmitt
Journal: International Journal of Geographical Information Science
Publisher: Taylor & Francis
Year: 2014
DOI: 10.1080/13658816.2014.914521
Link: https://www.tandfonline.com/doi/abs/10.1080/13658816.2014.914521#.U8P6N1bsd8E

A Visual Analytics Framework for Large Transportation Datasets (CAADRIA 2014)
Conference: 19th International Conference on Computer-Aided Architectural Design Research in Asia CAADRIA 2014
Authors: Chen Zhong, Stefan Arisona, Gerhard Schmitt
Abstract: The advancement of sensor technologies makes it possible to collect large amounts of dynamic urban data. On the other hand, how to store, process, and analyze collected urban data to make them useful becomes a new challenge. To address this issue, this paper proposes a visual analytics framework, which is applied to transportation data to manage and extract information for urban studies. More specif- ically, the proposed framework has three components: (1) a geographic information system (GIS) based pipeline providing basic data processing functions; (2) a spatial network analysis that is integrated into the pipeline for extracting spatial structure of urban movement; (3) interactive operations allowing the user to explore and view the output data sets at different levels of details. Taking Singapore as a case study area, we use a sample data set from the automatic smart card fare collection system as an input to our prototype tool. The result shows the feasibility of proposed framework and analysis method. To summarize, our work shows the potential of geospatial based visual analytics tools in using ‘big’ data for urban analysis.
Award: Won best presentation award.
Title: A Visual Analytics Framework for Large Transportation Datasets
Authors: Chen Zhong, Stefan Arisona, Gerhard Schmitt
Proceedings: 19th International Conference on Computer- Aided Architectural Design Research in Asia CAADRIA 2014
Publisher: The Association for Computer-Aided Architectural Design Research in Asia (CAADRIA)
Year: 2014
Pages: 223 - 232
Link: https://cumincad.scix.net/cgi-bin/works/Show?caadria2014_014
Summer School "Future Cities: Networks and Grammars" (24.6 - 12.7.2013)
From 24. June - 12. July, the Future Cities Laboratory will host the “Future Cities 2013” summer school on “Networks and Grammars”. As part of the programme, my colleagues and I will be teaching hands-on crash courses using Esri CityEngine.
More information: https://www.sustainability.ethz.ch/lehre/Sommerakademien/so2013/index_EN
Visualizing Interchange Patterns in Massive Movement Data (EuroVis 2013)
Authors: Wei Zeng, Chi-Wing Fu, Stefan Arisona, Huamin Qu
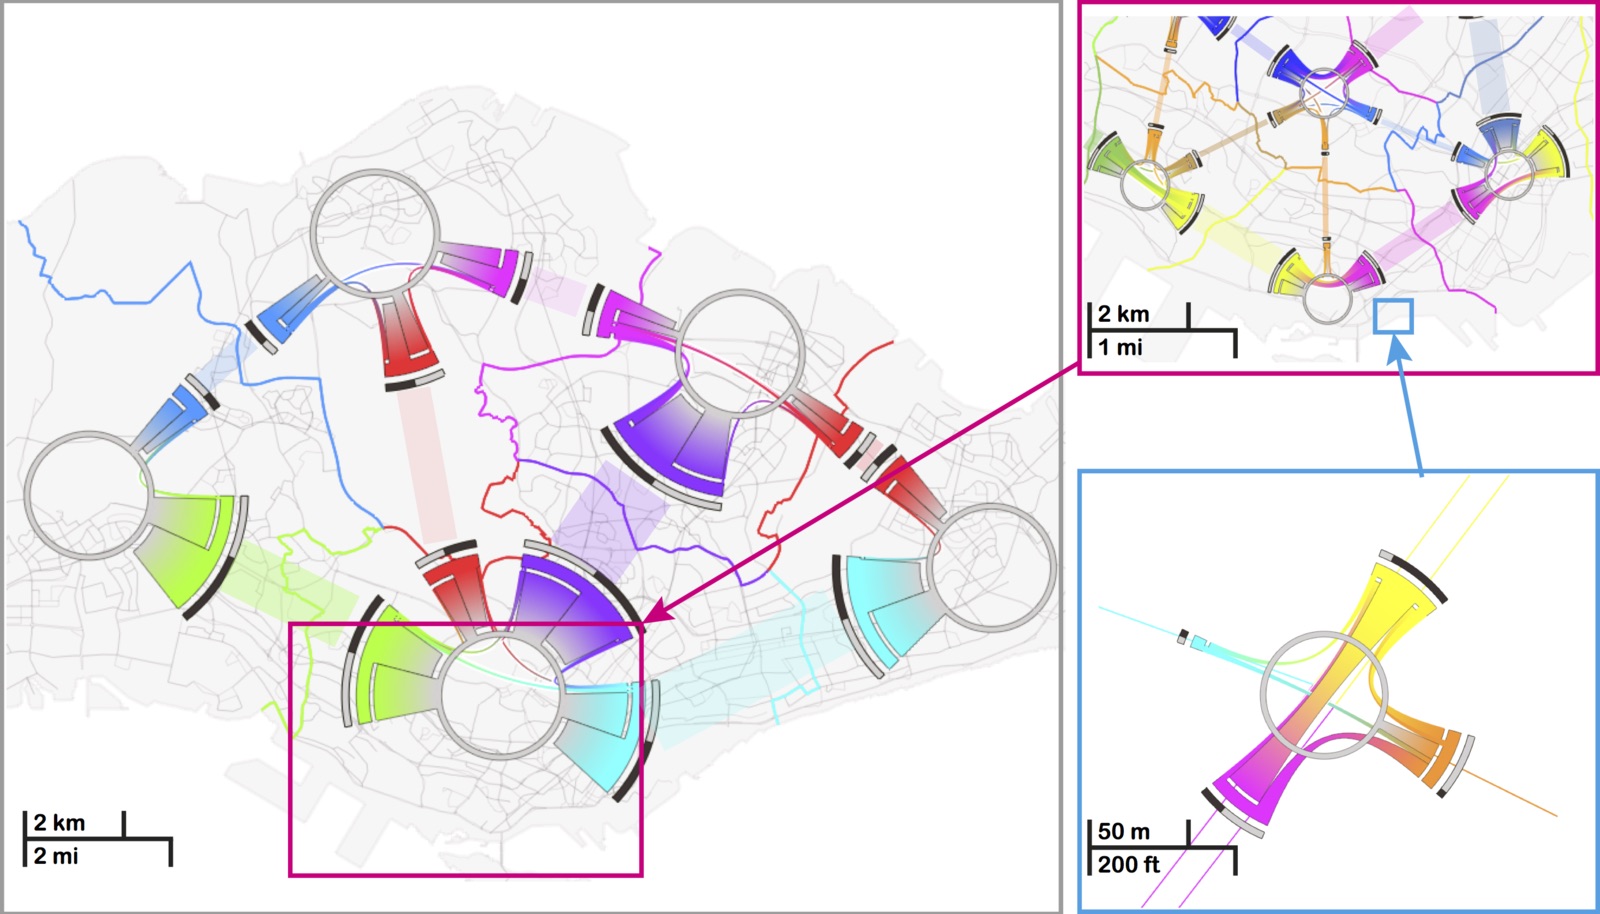
Abstract: Massive amount of movement data, such as daily trips made by millions of passengers in a city, are widely avail- able nowadays. They are a highly valuable means not only for unveiling human mobility patterns, but also for assisting transportation planning, in particular for metropolises around the world. In this paper, we focus on a novel aspect of visualizing and analyzing massive movement data, i.e., the interchange pattern, aiming at re- vealing passenger redistribution in a traffic network. We first formulate a new model of circos figure, namely the interchange circos diagram, to present interchange patterns at a junction node in a bundled fashion, and optimize the color assignments to respect the connections within and between junction nodes. Based on this, we develop a family of visual analysis techniques to help users interactively study interchange patterns in a spatiotemporal manner: 1) multi-spatial scales: from network junctions such as train stations to people flow across and between larger spatial areas; and 2) temporal changes of patterns from different times of the day. Our techniques have been applied to real movement data consisting of hundred thousands of trips, and we present also two case studies on how transportation experts worked with our interface.
https://www.youtube.com/watch?v=_QWnA1k2ZrU
Title: Visualizing Interchange Patterns in Massive Movement Data
Authors: Wei Zeng, Chi-Wing Fu, Stefan Arisona, Huamin Qu
Journal: Computer Graphics Forum
Publisher: Wiley
Year: 2013
Volume: 32(3)
Pages: 271-280
DOI: 10.1111/cgf.12114
Link: https://onlinelibrary.wiley.com/doi/10.1111/cgf.12114/abstract