
Tag: Publication
15 posts tagged with "Publication"
Book: Live Visuals - History, Theory, Practice
Edited by: Steve Gibson, Stefan Arisona, Donna Leishman and Atau Tanaka, 2022
From the publisher:
This volume surveys the key histories, theories and practice of artists, musicians, filmmakers, designers, architects and technologists that have worked and continue to work with visual material in real time.
Covering a wide historical period from Pythagoras’s mathematics of music and colour in ancient Greece, to Castel’s ocular harpsichord in the 18th century, to the visual music of the mid-20th century, to the liquid light shows of the 1960s and finally to the virtual reality and projection mapping of the present moment, Live Visuals is both an overarching history of real-time visuals and audio-visual art and a crucial source for understanding the various theories about audio-visual synchronization. With the inclusion of an overview of various forms of contemporary practice in Live Visuals culture – from VJing to immersive environments, architecture to design – Live Visuals also presents the key ideas of practitioners who work with the visual in a live context.
This book will appeal to a wide range of scholars, students, artists, designers and enthusiasts. It will particularly interest VJs, DJs, electronic musicians, filmmakers, interaction designers and technologists.
Read more on the publishers site: https://www.routledge.com/Live-Visuals-History-Theory-Practice/Gibson-Arisona-Leishman-Tanaka/p/book/9781032252681

Real-Time Snow Cover Simulation (Computers & Graphics)
Title: Real-time GIS-based Snow Cover Approximation and Rendering for Large Terrains
Journal: Computers & Graphics
Authors: Benjamin Neukom, Stefan Arisona, Simon Schubiger
Abstract: Various terrain visualization techniques based on geographic information system (GIS) data already exist. One major drawback of existing visualizations is that they do not capture seasonal variations well. Besides vegetation variations, in colder areas this particularly also applies to snow cover. In this paper, we propose a real-time multi-scale snow cover approximation and visualization for large terrains. The computation runs on a large grid, calculates the snow/water equivalent based on precipitation data from a GIS and snowmelt based on a physically-based solar radiation calculation combined with a degree-day snowmelt approach using level of detail (LOD). The snow visualization is divided into two parts: Zero thickness snow cover textures are generated for distant views. For close up views the terrain’s height field is modified using displacement maps and tessellation to produce thick snow covers. The GPU-based data-parallel computation and the visualization run on the GPU in real-time on a modern desktop computer. The implementation is tested using a real area in the Swiss Alps, with a size of 14.16 by 12.88 km, a grid resolution of 222 × 206, and a time step of 1 h. We compare the rendered results spanning several months with a time series of photographs from webcams for visual accuracy.
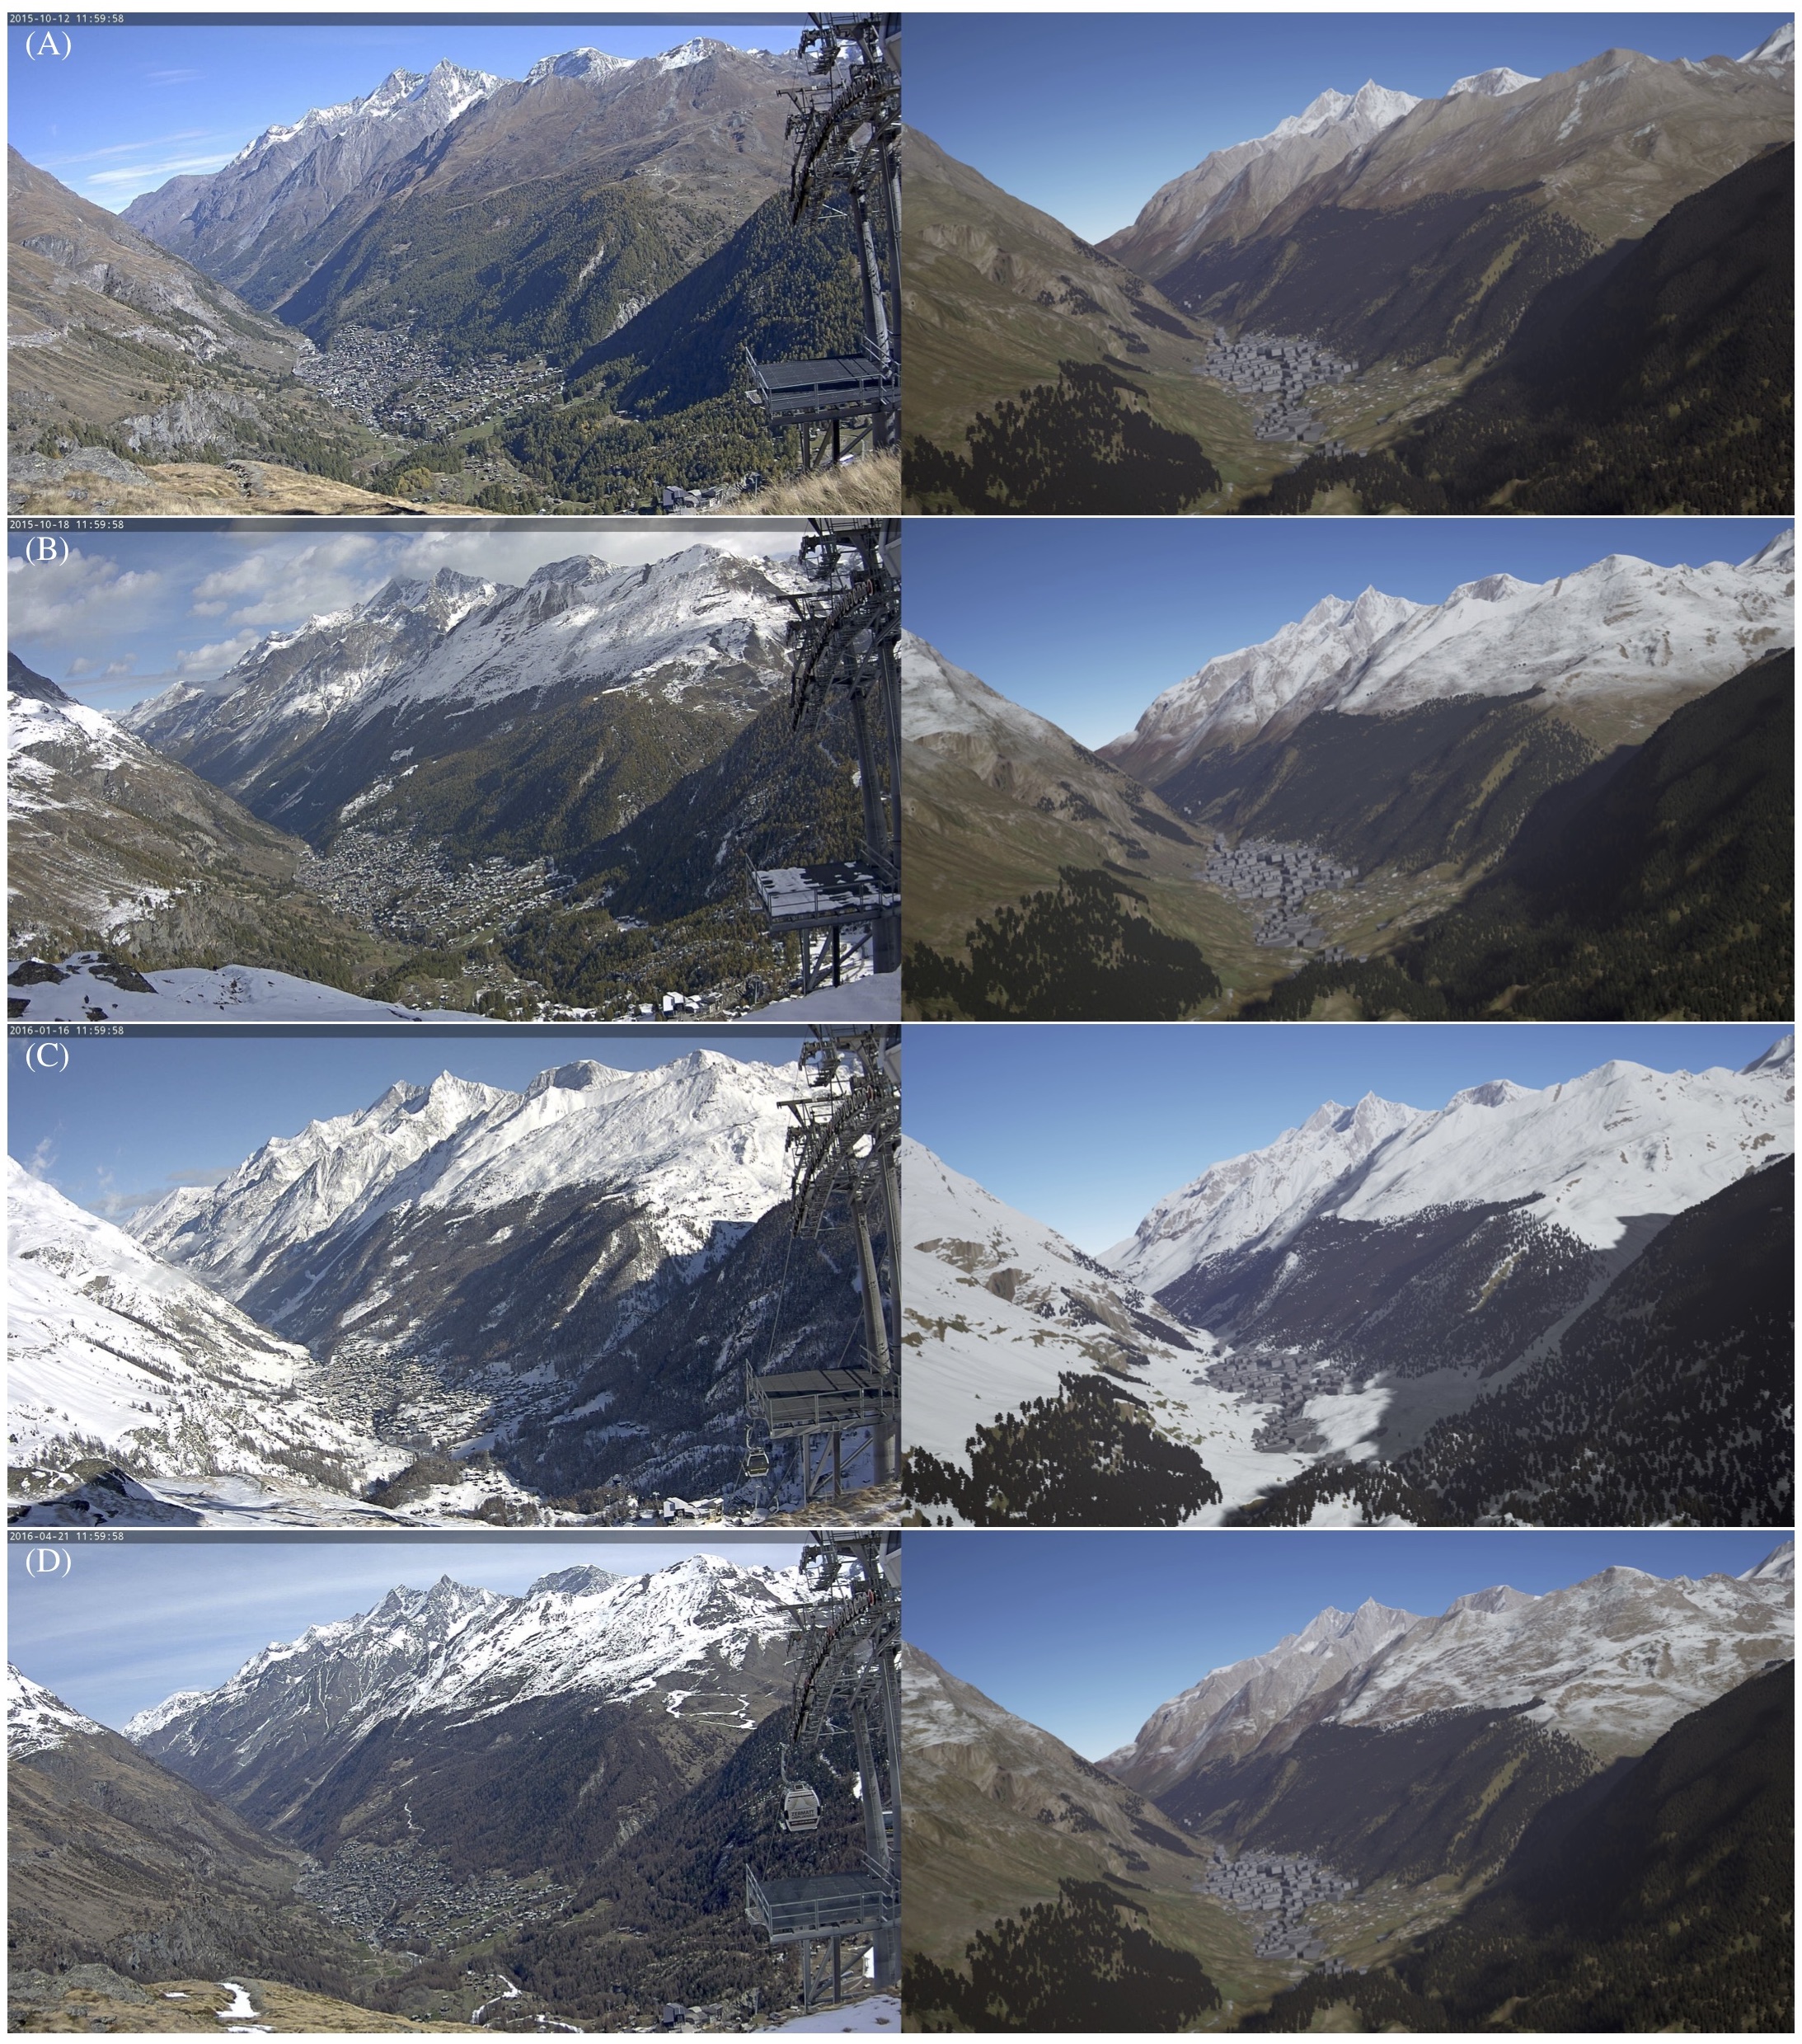
Comparison of webcam images (left) of Zermatt with our simulation (right). Trees were placed by hand and the sun position was approximated from the webcam image. (A) Start of the computation on 12.10.2015 with only the initial snow visible. (B) The results on 18.10.2015 after the first snowfall. The snowline was accurately computed. (C) The results on 16.01.2016 after the first heavy snowfall with the whole scene covered in snow. (D) The results on 21.04.2016 with snow beginning to melt as the temperature rises.
Code for Unreal Engine (open source): https://github.com/bneukom/UnrealSnow
Title: Visualizing Waypoints-Constrained Origin-Destination Patterns for Massive Transportation Data
Authors: Benjamin Neukom, Stefan Arisona, Simon Schubiger
Journal: Computers & Graphics
Publisher: Elsevier
Year: 2018
Link: https://doi.org/10.1016/j.cag.2017.10.003
Visualizing Waypoints-Constrained Origin-Destination Patterns for Massive Transportation Data (CGF)
Journal: Computer Graphics Forum
Authors: Wei Zeng, Chi-Wing Fu, Stefan Arisona, Alexander Erath, Huamin Qu
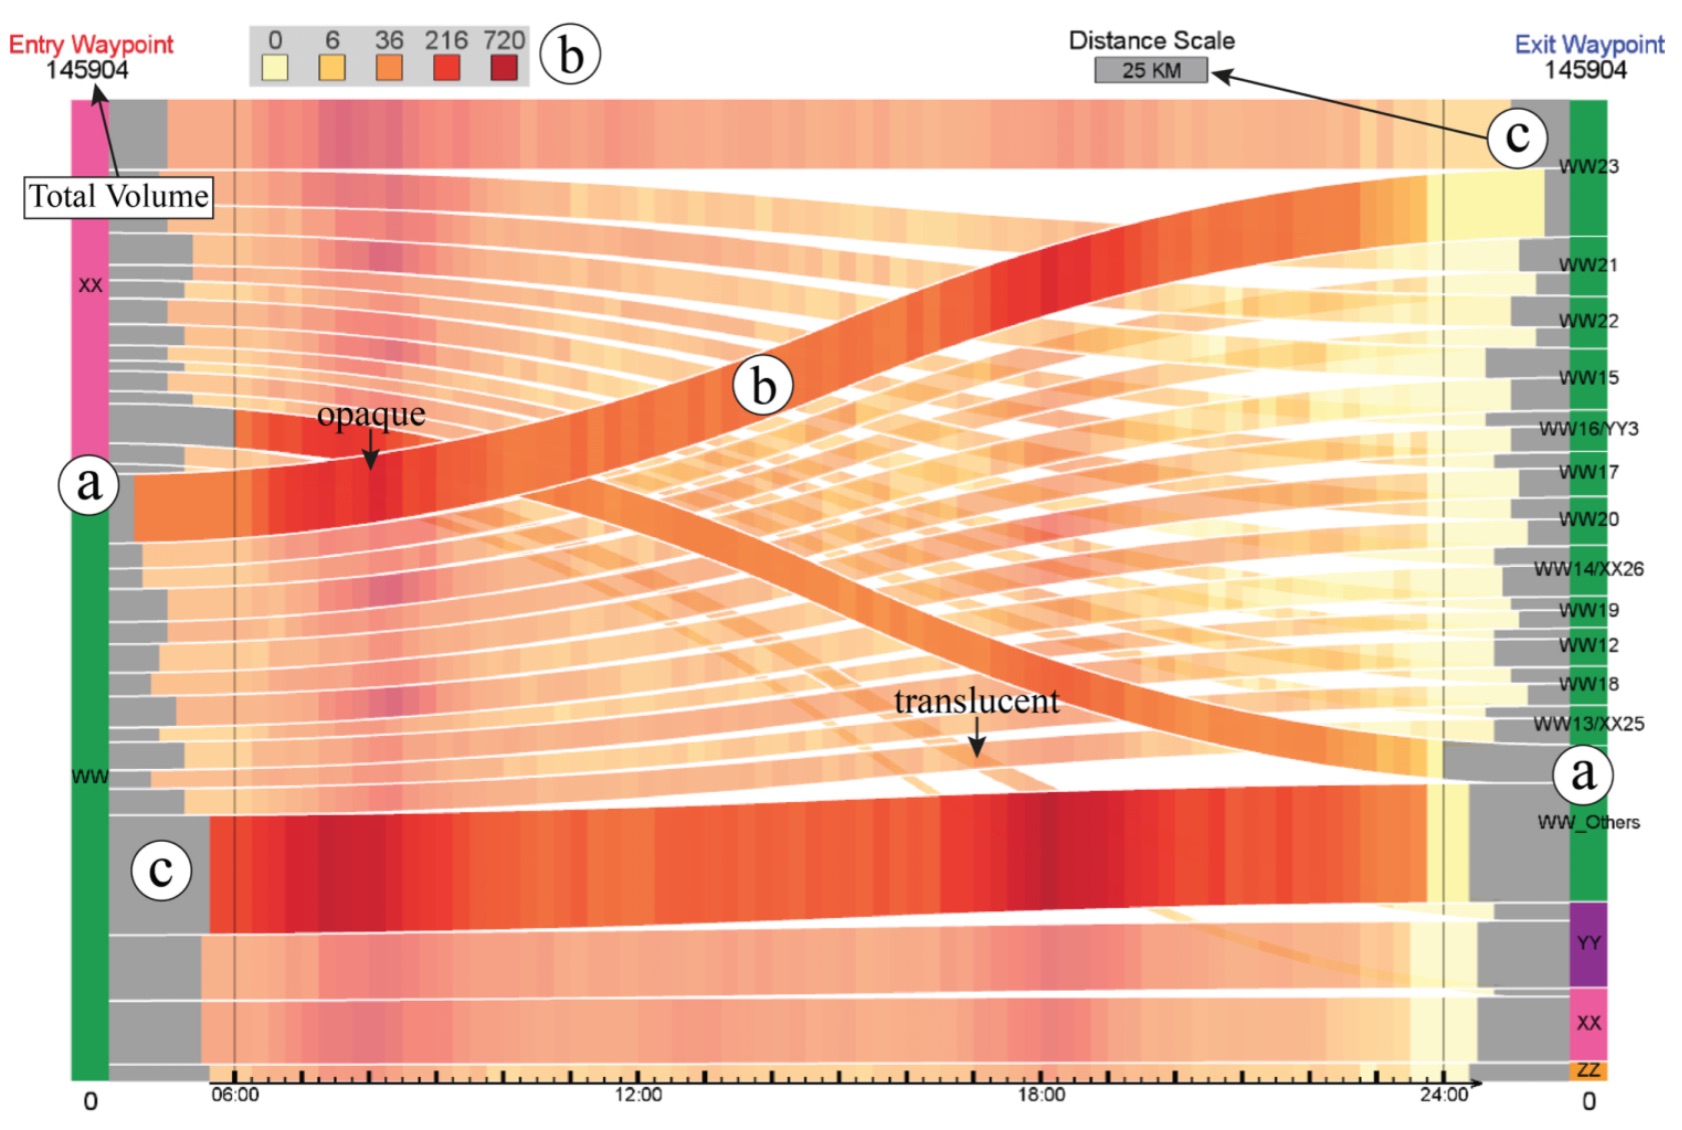
Abstract: Origin-destination (OD) pattern is a highly useful means for transportation research since it summarizes urban dynamics and human mobility. However, existing visual analytics are insufficient for certain OD analytical tasks needed in transport research. For example, transport researchers are interested in path-related movements across congested roads, besides global patterns over the entire domain. Driven by this need, we propose waypoints-constrained OD visual analytics, a new approach for exploring path-related OD patterns in an urban transportation network. First, we use hashing-based query to support interactive filtering of trajectories through user-specified waypoints. Second, we elaborate a set of design principles and rules, and derive a novel unified visual representation called the waypoints-constrained OD view by carefully considering the OD flow presentation, the temporal variation, spatial layout and user interaction. Finally, we demonstrate the effectiveness of our interface with two case studies and expert interviews with five transportation experts.
Title: Visualizing Waypoints-Constrained Origin-Destination Patterns for Massive Transportation Data
Authors: Wei Zeng, Chi-Wing Fu, Stefan Arisona, Alexander Erath, Huamin Qu
Journal: Computer Graphics Forum
Publisher: Eurographics Association
Year: 2015
Link: https://dx.doi.org/10.1111/cgf.12778
Time–Space Diagram Revisited (TRR 2442)
Journal: Transportation Research Record: Journal of the Transportation Research Board.
Authors: Afian Anwar, Zeng Wei, Stefan Arisona
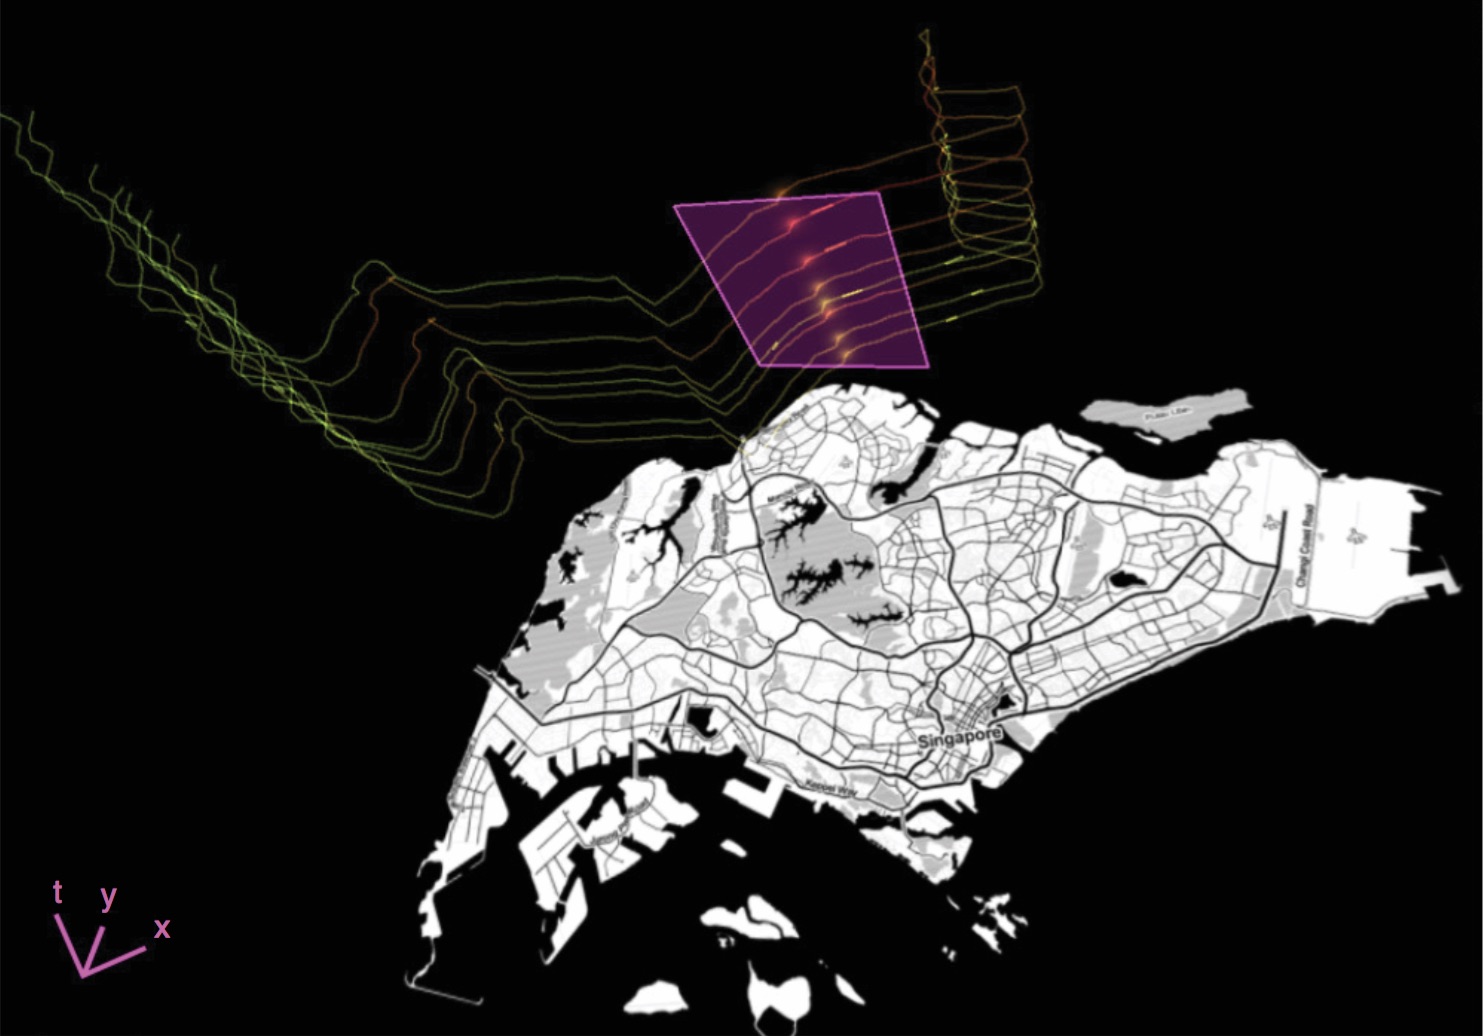
Abstract: Widely used in the design and analysis of transportation systems, time-space diagrams were developed in an era of data scarcity, when it was necessary to obtain data by means of driver logs, human observ- ers, and aerial photographs. This paper shows how time-space diagrams remain relevant today, in an era of data abundance. An application efficiently encodes the trajectories of bus GPS data in a time-space cube and uses simple geometric methods to calculate and to visualize the headways and separation of buses on a bus route. These methods are discussed in detail. How they can be used as the basis of a software package that monitors performance measures for a variety of applications is explored.
Title: Time-Space Diagram Revisited
Authors: Afian Anwar, Wei Zeng, Stefan Arisona
Journal: TRR
Publisher: TRB
Volume: 2442
Year: 2014
Pages: 1 - 7
Link: https://dx.doi.org/10.3141/2442-01
Visualizing Mobility of Public Transportation System (TVCG/VAST)
Journal: IEEE Transactions on Visualization and Computer Graphics (TVCG).
Conference: IEEE Visual Analytics Science and Technology (VAST) 2014.
Authors: Wei Zeng, Chi-Wing Fu, Stefan Arisona, Alexander Erath, Huamin Qu
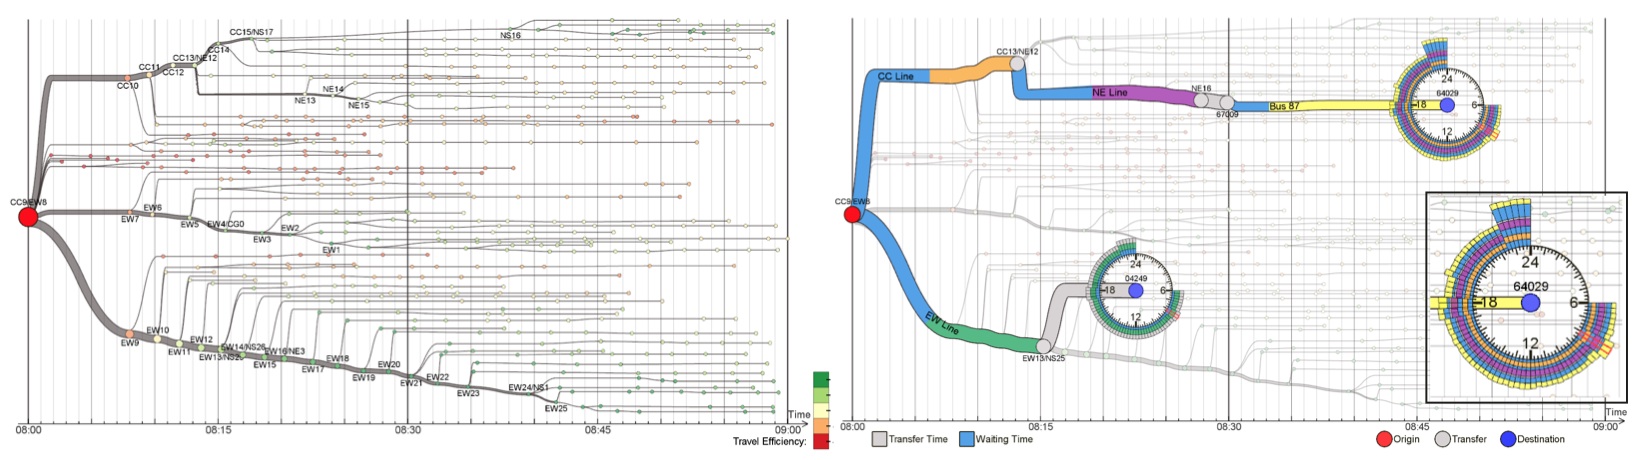
Abstract: Public transportation systems (PTSs) play an important role in modern cities, providing shared/massive transportation services that are essential for the general public. However, due to their increasing complexity, designing effective methods to visualize and explore PTS is highly challenging. Most existing techniques employ network visualization methods and focus on showing the network topology across stops while ignoring various mobility-related factors such as riding time, transfer time, waiting time, and round-the-clock patterns. This work aims to visualize and explore passenger mobility in a PTS with a family of analytical tasks based on inputs from transportation researchers. After exploring different design alternatives, we come up with an integrated solution with three visualization modules: isochrone map view for geographical information, isotime flow map view for effective temporal information comparison and manipulation, and OD-pair journey view for detailed visual analysis of mobility factors along routes between specific origin-destination pairs. The isotime flow map linearizes a flow map into a parallel isoline representation, maximizing the visualization of mobility information along the horizontal time axis while presenting clear and smooth pathways from origin to destinations. Moreover, we devise several interactive visual query methods for users to easily explore the dynamics of PTS mobility over space and time. Lastly, we also construct a PTS mobility model from millions of real passenger trajectories, and evaluate our visualization techniques with assorted case studies with the transportation researchers.
https://www.youtube.com/watch?v=Q95c8PpneT8
Title: Visualizing Mobility of Public Transportation System
Authors: Wei Zeng, Chi-Wing Fu, Stefan Arisona, Alexander Erath, Huamin Qu
Journal: IEEE TVCG
Publisher: IEEE
Volume: 20(12)
Year: 2014
Pages: 1833 - 1842
Link: https://dx.doi.org/10.1109/TVCG.2014.2346893