
Tag: Visual Analytics
6 posts tagged with "Visual Analytics"
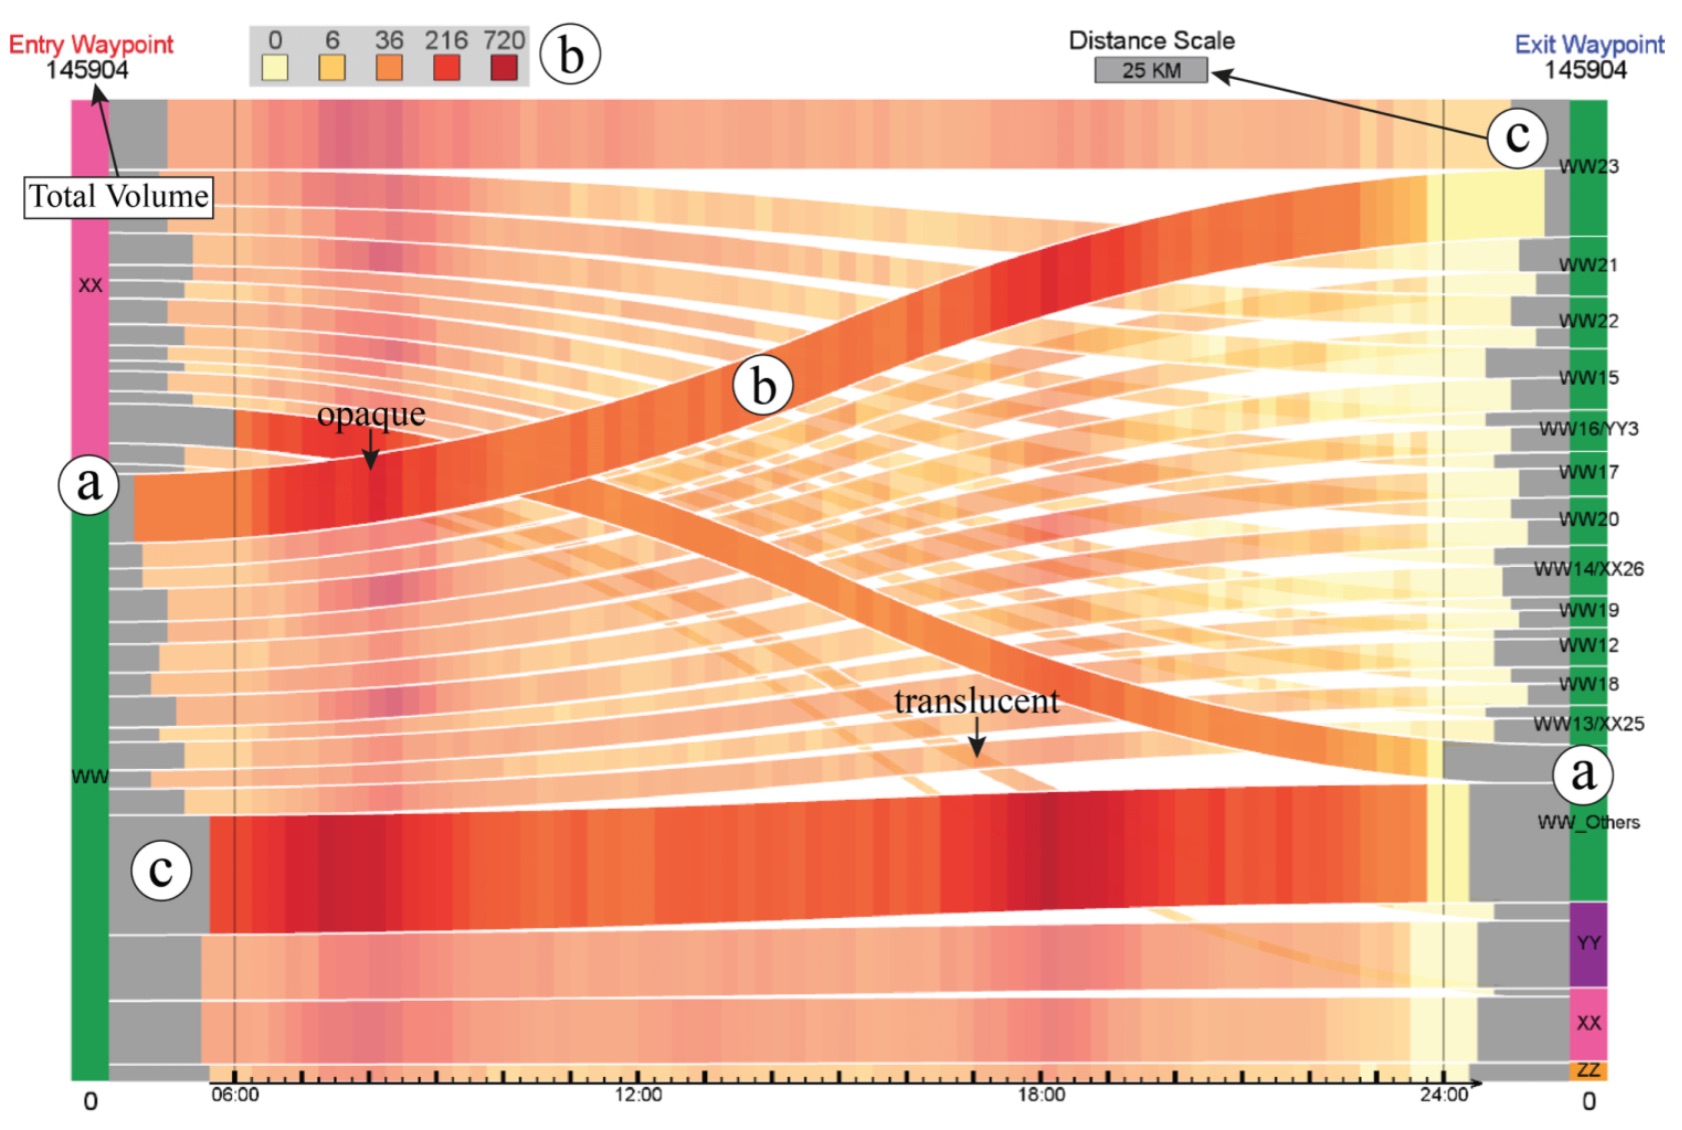
Visualizing Waypoints-Constrained Origin-Destination Patterns for Massive Transportation Data (CGF)
Journal: Computer Graphics Forum
Authors: Wei Zeng, Chi-Wing Fu, Stefan Arisona, Alexander Erath, Huamin Qu
Abstract: Origin-destination (OD) pattern is a highly useful means for transportation research since it summarizes urban dynamics and human mobility. However, existing visual analytics are insufficient for certain OD analytical tasks needed in transport research. For example, transport researchers are interested in path-related movements across congested roads, besides global patterns over the entire domain. Driven by this need, we propose waypoints-constrained OD visual analytics, a new approach for exploring path-related OD patterns in an urban transportation network. First, we use hashing-based query to support interactive filtering of trajectories through user-specified waypoints. Second, we elaborate a set of design principles and rules, and derive a novel unified visual representation called the waypoints-constrained OD view by carefully considering the OD flow presentation, the temporal variation, spatial layout and user interaction. Finally, we demonstrate the effectiveness of our interface with two case studies and expert interviews with five transportation experts.
Title: Visualizing Waypoints-Constrained Origin-Destination Patterns for Massive Transportation Data
Authors: Wei Zeng, Chi-Wing Fu, Stefan Arisona, Alexander Erath, Huamin Qu
Journal: Computer Graphics Forum
Publisher: Eurographics Association
Year: 2015
Link: https://dx.doi.org/10.1111/cgf.12778
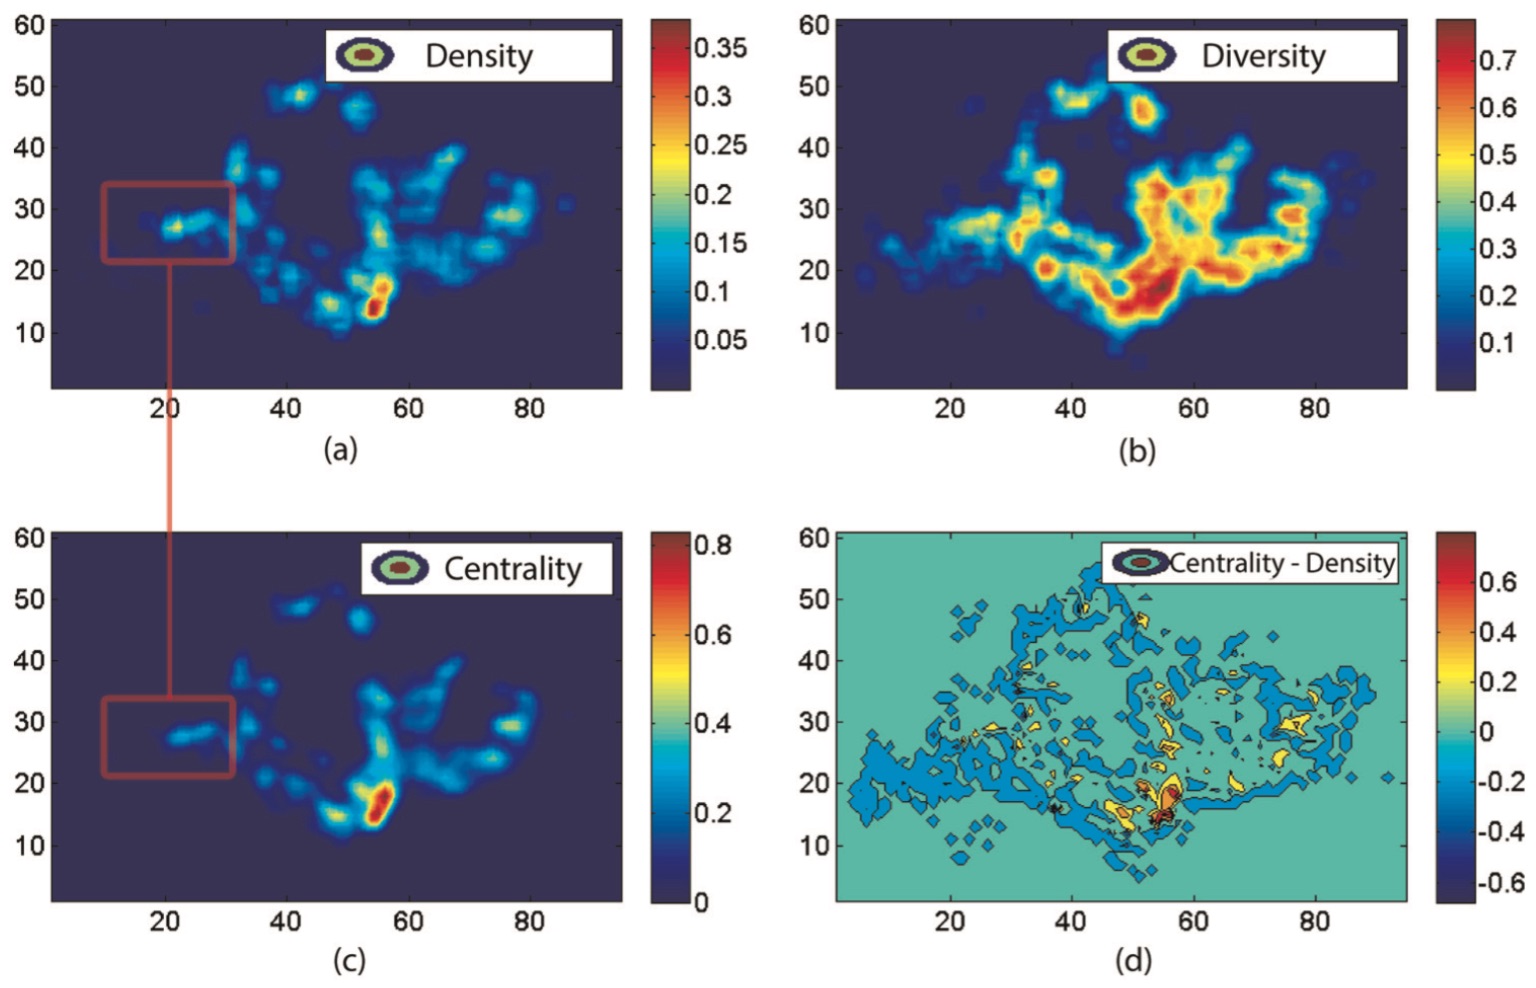
Revealing Centrality in the Spatial Structure of Cities from Human Activity Patterns (Urban Studies)
Journal: Urban Studies
Authors: Chen Zhong, Markus Schläpfer, Stefan Arisona, Michael Batty, Carlo Ratti, Gerhard Schmitt
Abstract: Identifying changes in the spatial structure of cities is a prerequisite for the development and vali- dation of adequate planning strategies. Nevertheless, current methods of measurement are becoming ever more challenged by the highly diverse and intertwined ways of how people actually make use of urban space. Here, we propose a new quantitative measure for the centrality of locations, taking into account not only the numbers of people attracted to different locations, but also the diversity of the activities they are engaged in. This ‘centrality index’ allows for the identifi- cation of functional urban centres and for a systematic tracking of their relative importance over time, thus contributing to our understanding of polycentricity. We demonstrate the proposed index using travel survey data in Singapore for different years between 1997 and 2012. It is shown that, on the one hand, the city-state has been developing rapidly towards a polycentric urban form that compares rather closely with the official urban development plan. On the other hand, however, the downtown core has strongly gained in its importance, and this can be partly attrib- uted to the recent extension of the public transit system.
Title: Time-Space Diagram Revisited
Authors: Chen Zhong, Markus Schläpfer, Stefan Arisona, Michael Batty, Carlo Ratti, Gerhard Schmitt
Journal: Urban Studies
Publisher: Sage
Year: 2015
Link: https://dx.doi.org/10.1177/0042098015601599
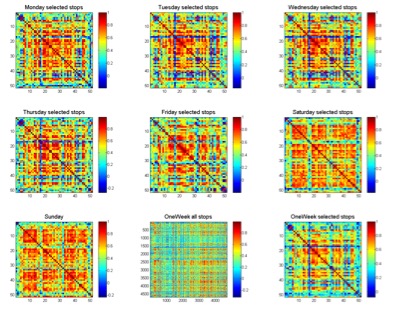
Measuring Variability of Mobility Patterns from Multiday Smart-card Data (JOCS 2015)
Journal: Journal of Computational Science
Authors: Chen Zhong, Ed Manley, Stefan Arisona, Michael Batty, Gerhard Schmitt
Abstract: The availability of large amounts of mobility data has stimulated the research in discovering patterns and understanding regularities. Comparatively, less attention has been paid to the study of variability, which, however, has been argued as equally important as regularities, since variability identifies diversity. In a transport network, variability exists from person to person, from place to place, and from day to day. In this paper, we present a set of measuring of variability at individual and aggregated levels using multi-day smart-card data. Statistical analysis, correlation matrix and network-based clustering methods are applied and potential use of measured results for urban applications are also discussed. We take Singapore as a case study and use one-week smart-card data for analysis. An interesting finding is that though the number of trips and mobility patterns varies from day to day, the overall spatial structure of urban movement always remains the same throughout a week. This finding showed that a systemic framework with well-organized analytical methods is indeed, necessary for extracting variability that may change at different levels and consequently for uncovering different aspects of dynamics, namely transit, social and urban dynamics. We consider this paper as a tentative work toward such generic framework for measuring variability and it can be used as a reference for other research work in such a direction.
Title: Time-Space Diagram Revisited
Authors: Chen Zhong, Ed Manley, Stefan Arisona, Michael Batty, Gerhard Schmitt
Journal: Journal of Computational Science
Publisher: Elsevier
Volume: 9
Year: 2015
Pages: 125 - 130
Link: https://dx.doi.org/10.1016/j.jocs.2015.04.021
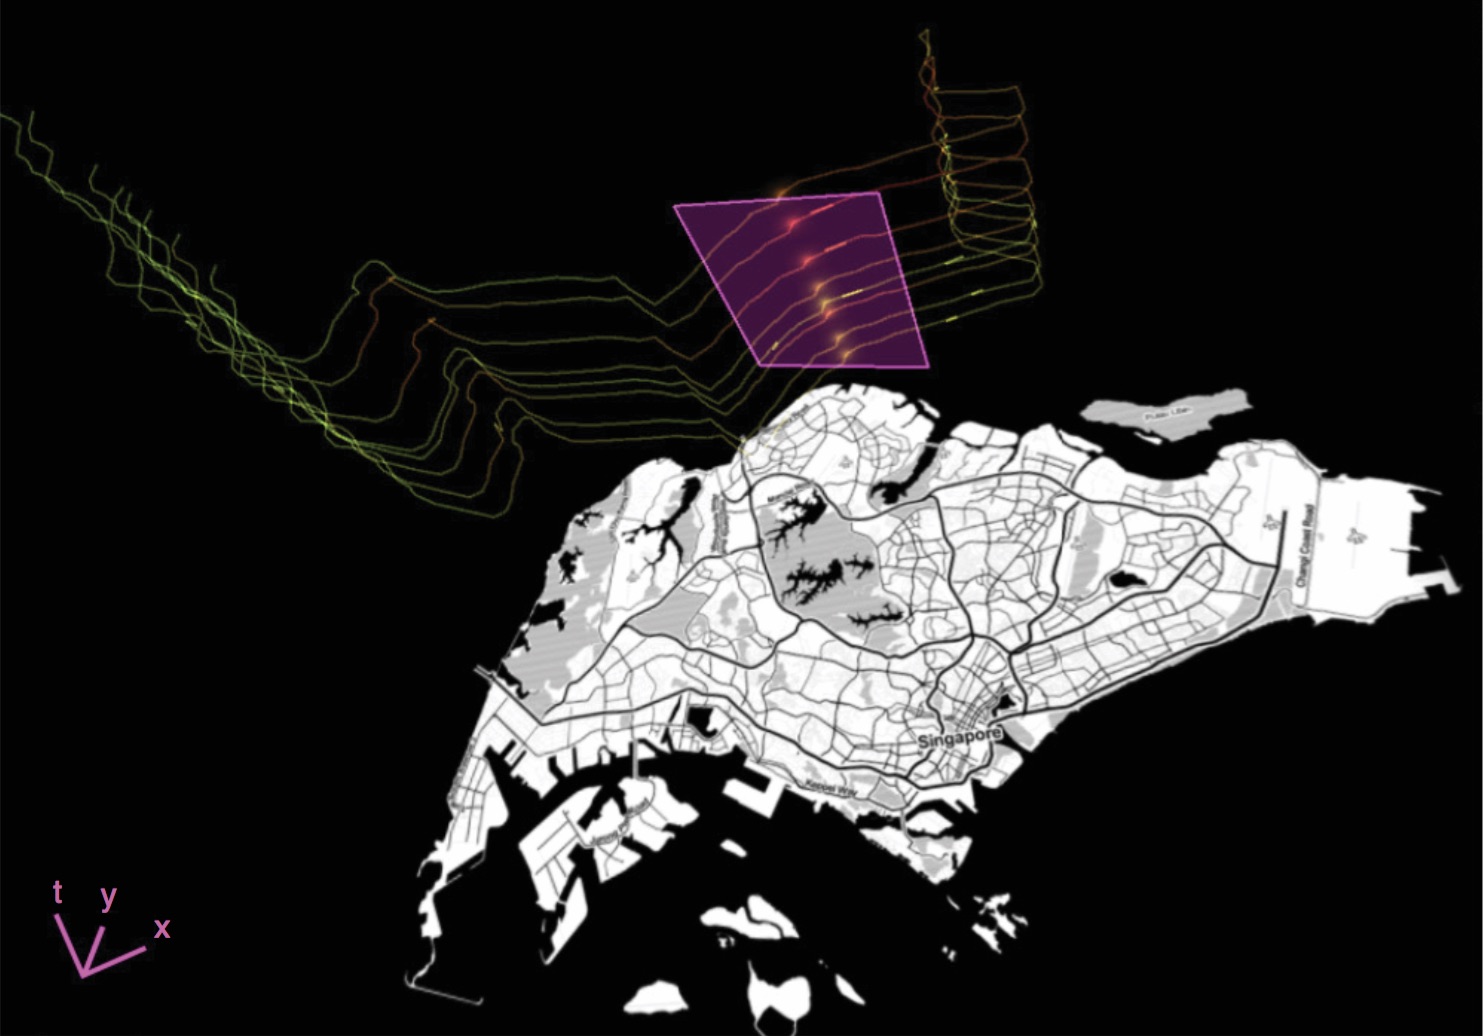
Time–Space Diagram Revisited (TRR 2442)
Journal: Transportation Research Record: Journal of the Transportation Research Board.
Authors: Afian Anwar, Zeng Wei, Stefan Arisona
Abstract: Widely used in the design and analysis of transportation systems, time-space diagrams were developed in an era of data scarcity, when it was necessary to obtain data by means of driver logs, human observ- ers, and aerial photographs. This paper shows how time-space diagrams remain relevant today, in an era of data abundance. An application efficiently encodes the trajectories of bus GPS data in a time-space cube and uses simple geometric methods to calculate and to visualize the headways and separation of buses on a bus route. These methods are discussed in detail. How they can be used as the basis of a software package that monitors performance measures for a variety of applications is explored.
Title: Time-Space Diagram Revisited
Authors: Afian Anwar, Wei Zeng, Stefan Arisona
Journal: TRR
Publisher: TRB
Volume: 2442
Year: 2014
Pages: 1 - 7
Link: https://dx.doi.org/10.3141/2442-01
Visualizing Mobility of Public Transportation System (TVCG/VAST)
Journal: IEEE Transactions on Visualization and Computer Graphics (TVCG).
Conference: IEEE Visual Analytics Science and Technology (VAST) 2014.
Authors: Wei Zeng, Chi-Wing Fu, Stefan Arisona, Alexander Erath, Huamin Qu
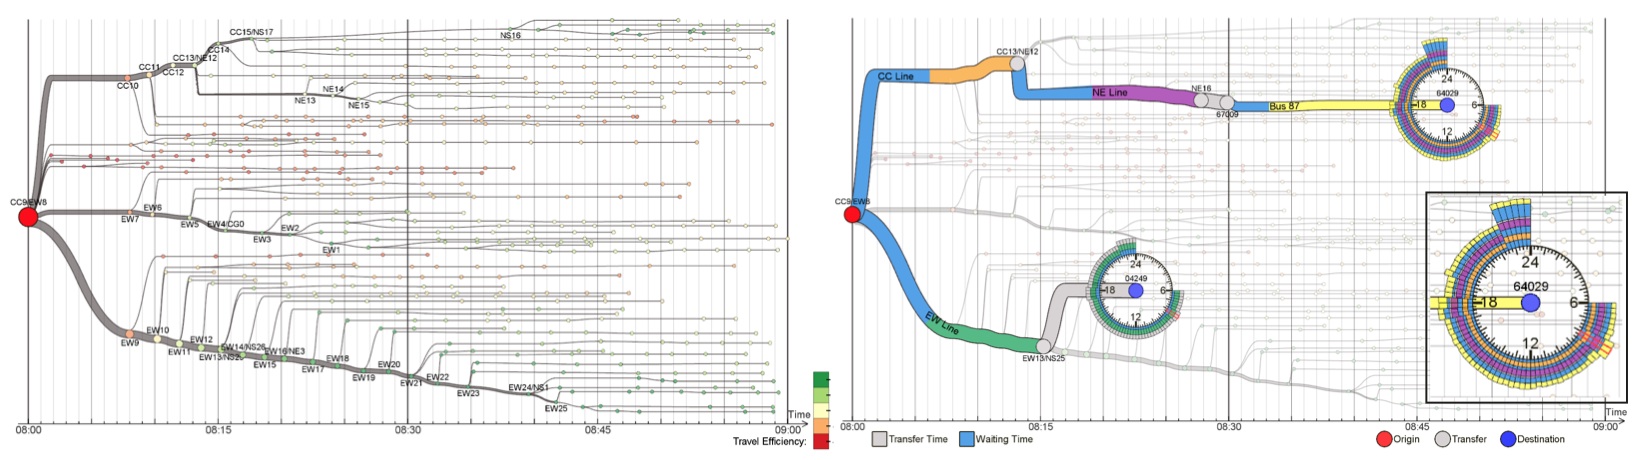
Abstract: Public transportation systems (PTSs) play an important role in modern cities, providing shared/massive transportation services that are essential for the general public. However, due to their increasing complexity, designing effective methods to visualize and explore PTS is highly challenging. Most existing techniques employ network visualization methods and focus on showing the network topology across stops while ignoring various mobility-related factors such as riding time, transfer time, waiting time, and round-the-clock patterns. This work aims to visualize and explore passenger mobility in a PTS with a family of analytical tasks based on inputs from transportation researchers. After exploring different design alternatives, we come up with an integrated solution with three visualization modules: isochrone map view for geographical information, isotime flow map view for effective temporal information comparison and manipulation, and OD-pair journey view for detailed visual analysis of mobility factors along routes between specific origin-destination pairs. The isotime flow map linearizes a flow map into a parallel isoline representation, maximizing the visualization of mobility information along the horizontal time axis while presenting clear and smooth pathways from origin to destinations. Moreover, we devise several interactive visual query methods for users to easily explore the dynamics of PTS mobility over space and time. Lastly, we also construct a PTS mobility model from millions of real passenger trajectories, and evaluate our visualization techniques with assorted case studies with the transportation researchers.
https://www.youtube.com/watch?v=Q95c8PpneT8
Title: Visualizing Mobility of Public Transportation System
Authors: Wei Zeng, Chi-Wing Fu, Stefan Arisona, Alexander Erath, Huamin Qu
Journal: IEEE TVCG
Publisher: IEEE
Volume: 20(12)
Year: 2014
Pages: 1833 - 1842
Link: https://dx.doi.org/10.1109/TVCG.2014.2346893