
Tag: Visualization
17 posts tagged with "Visualization"

Real-Time Snow Cover Simulation (Computers & Graphics)
Title: Real-time GIS-based Snow Cover Approximation and Rendering for Large Terrains
Journal: Computers & Graphics
Authors: Benjamin Neukom, Stefan Arisona, Simon Schubiger
Abstract: Various terrain visualization techniques based on geographic information system (GIS) data already exist. One major drawback of existing visualizations is that they do not capture seasonal variations well. Besides vegetation variations, in colder areas this particularly also applies to snow cover. In this paper, we propose a real-time multi-scale snow cover approximation and visualization for large terrains. The computation runs on a large grid, calculates the snow/water equivalent based on precipitation data from a GIS and snowmelt based on a physically-based solar radiation calculation combined with a degree-day snowmelt approach using level of detail (LOD). The snow visualization is divided into two parts: Zero thickness snow cover textures are generated for distant views. For close up views the terrain’s height field is modified using displacement maps and tessellation to produce thick snow covers. The GPU-based data-parallel computation and the visualization run on the GPU in real-time on a modern desktop computer. The implementation is tested using a real area in the Swiss Alps, with a size of 14.16 by 12.88 km, a grid resolution of 222 × 206, and a time step of 1 h. We compare the rendered results spanning several months with a time series of photographs from webcams for visual accuracy.
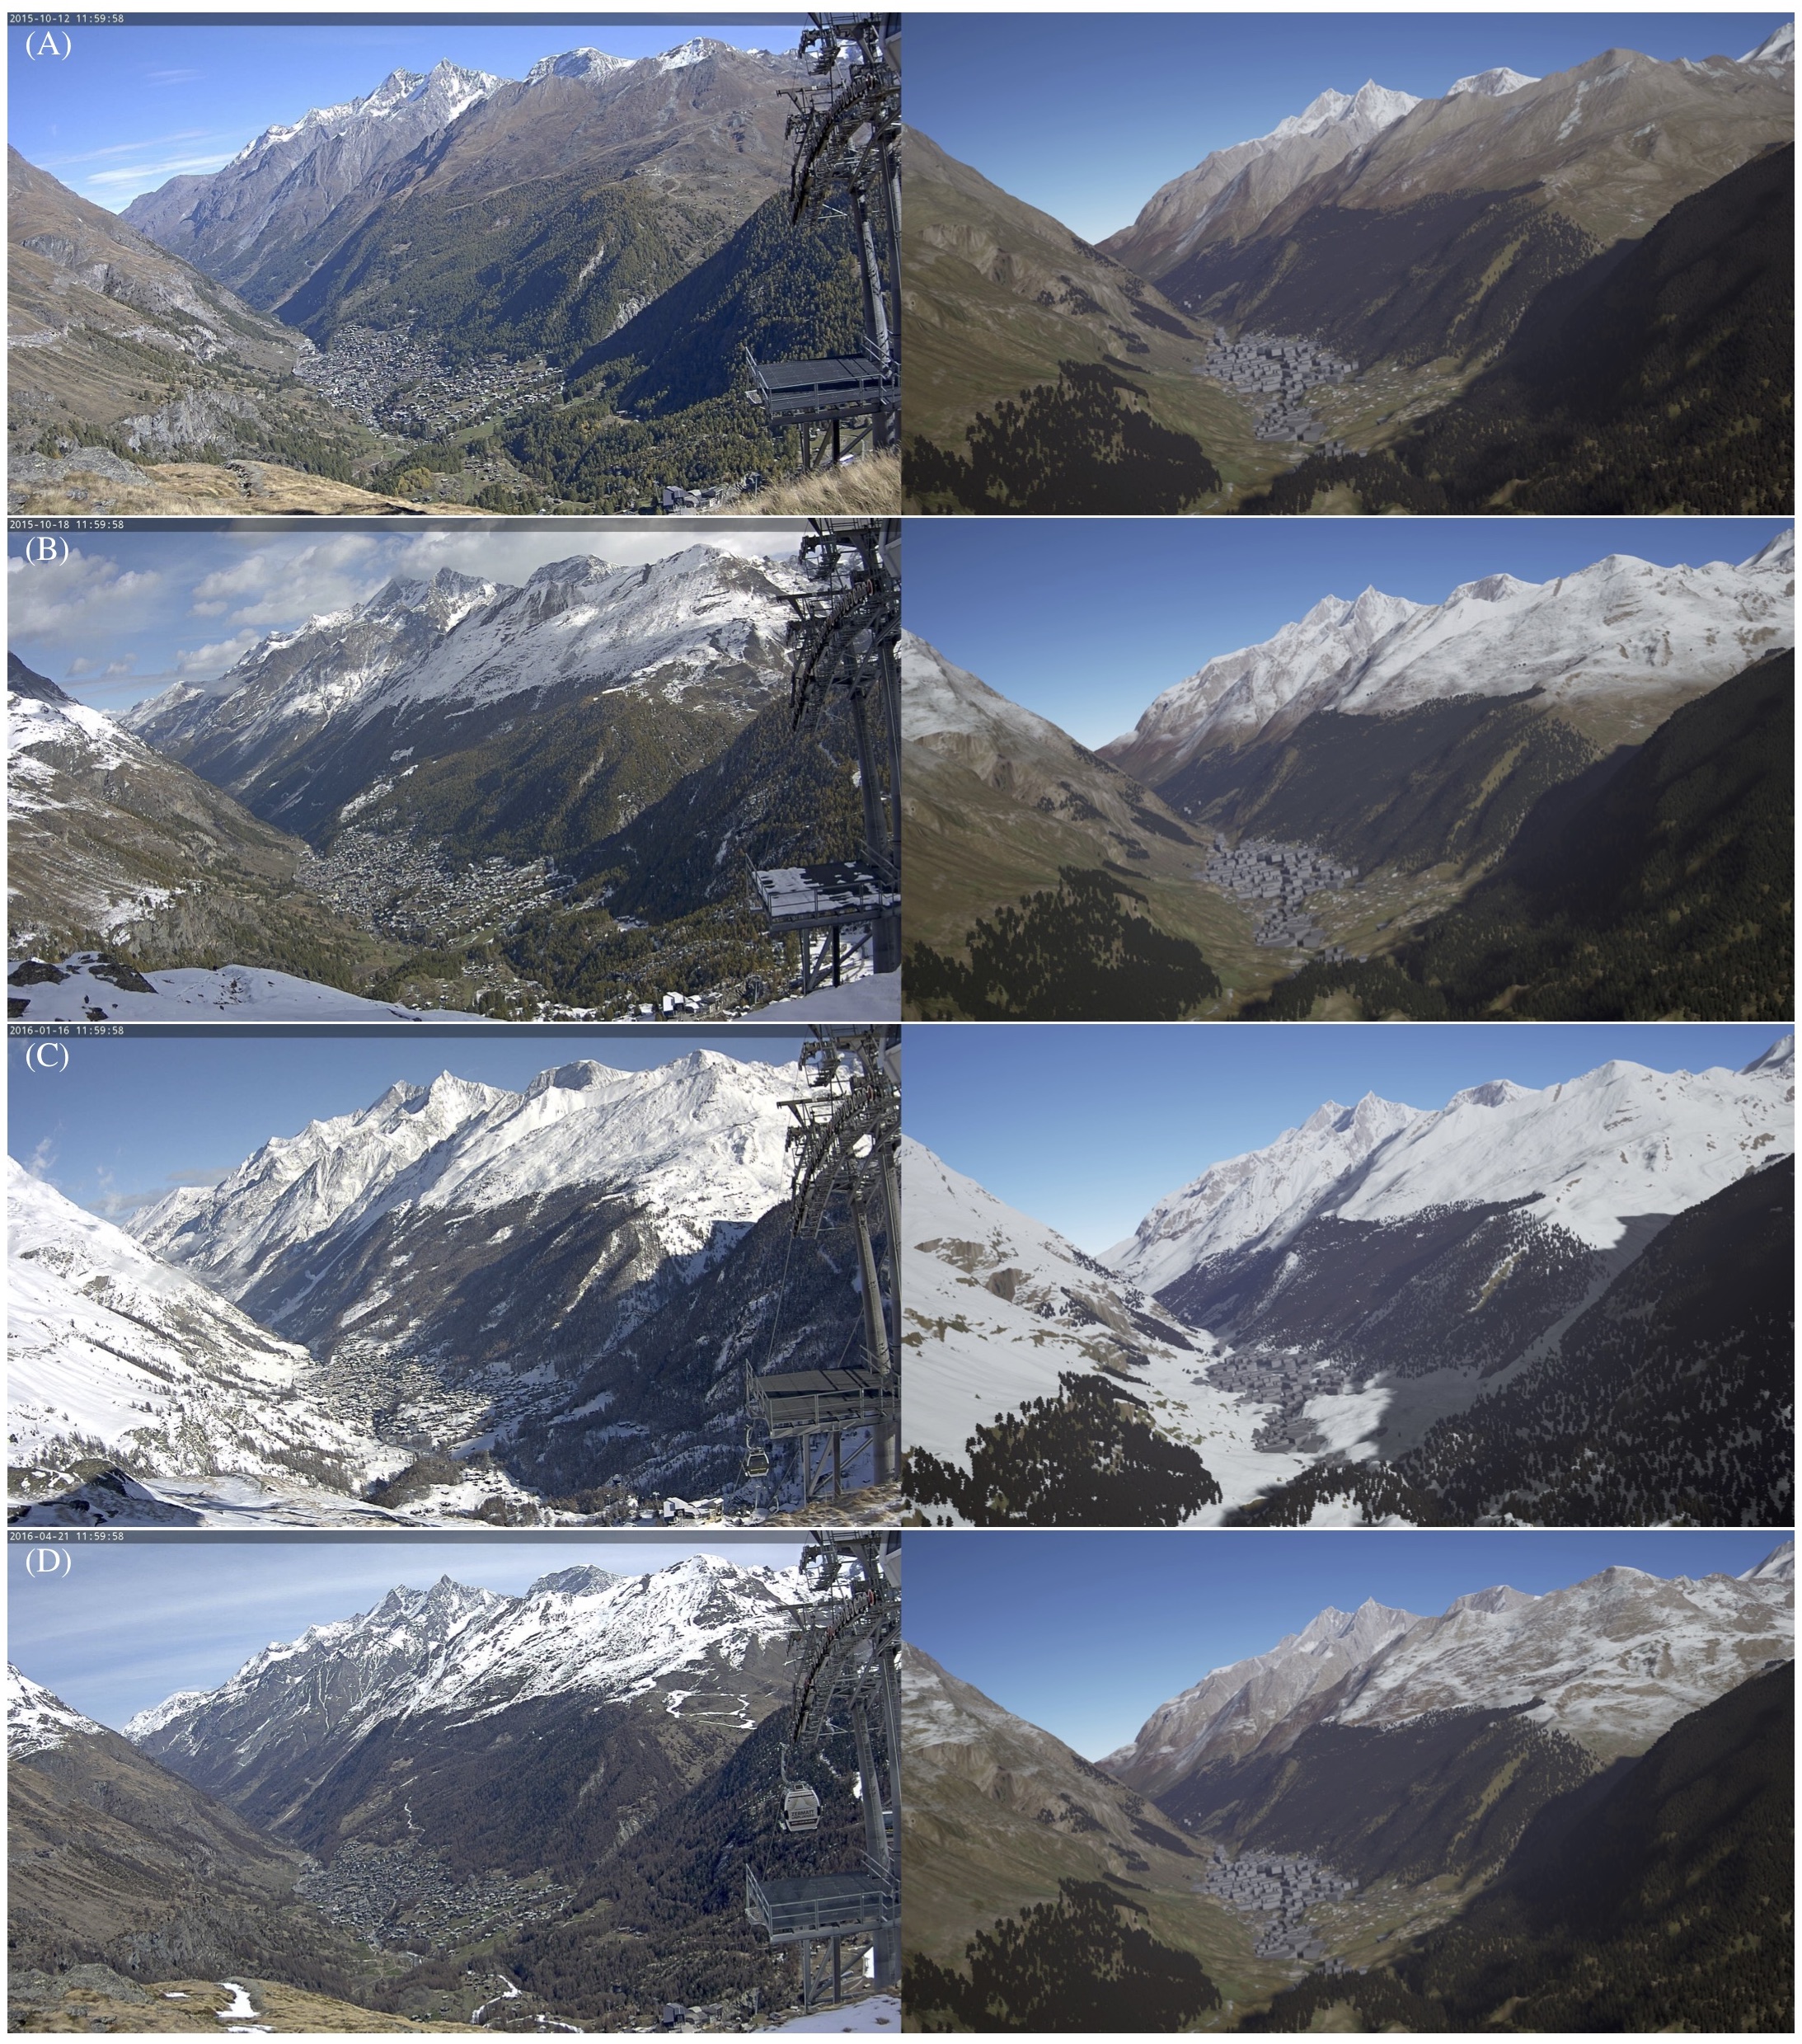
Comparison of webcam images (left) of Zermatt with our simulation (right). Trees were placed by hand and the sun position was approximated from the webcam image. (A) Start of the computation on 12.10.2015 with only the initial snow visible. (B) The results on 18.10.2015 after the first snowfall. The snowline was accurately computed. (C) The results on 16.01.2016 after the first heavy snowfall with the whole scene covered in snow. (D) The results on 21.04.2016 with snow beginning to melt as the temperature rises.
Code for Unreal Engine (open source): https://github.com/bneukom/UnrealSnow
Title: Visualizing Waypoints-Constrained Origin-Destination Patterns for Massive Transportation Data
Authors: Benjamin Neukom, Stefan Arisona, Simon Schubiger
Journal: Computers & Graphics
Publisher: Elsevier
Year: 2018
Link: https://doi.org/10.1016/j.cag.2017.10.003
Enabling DEMO:POLIS
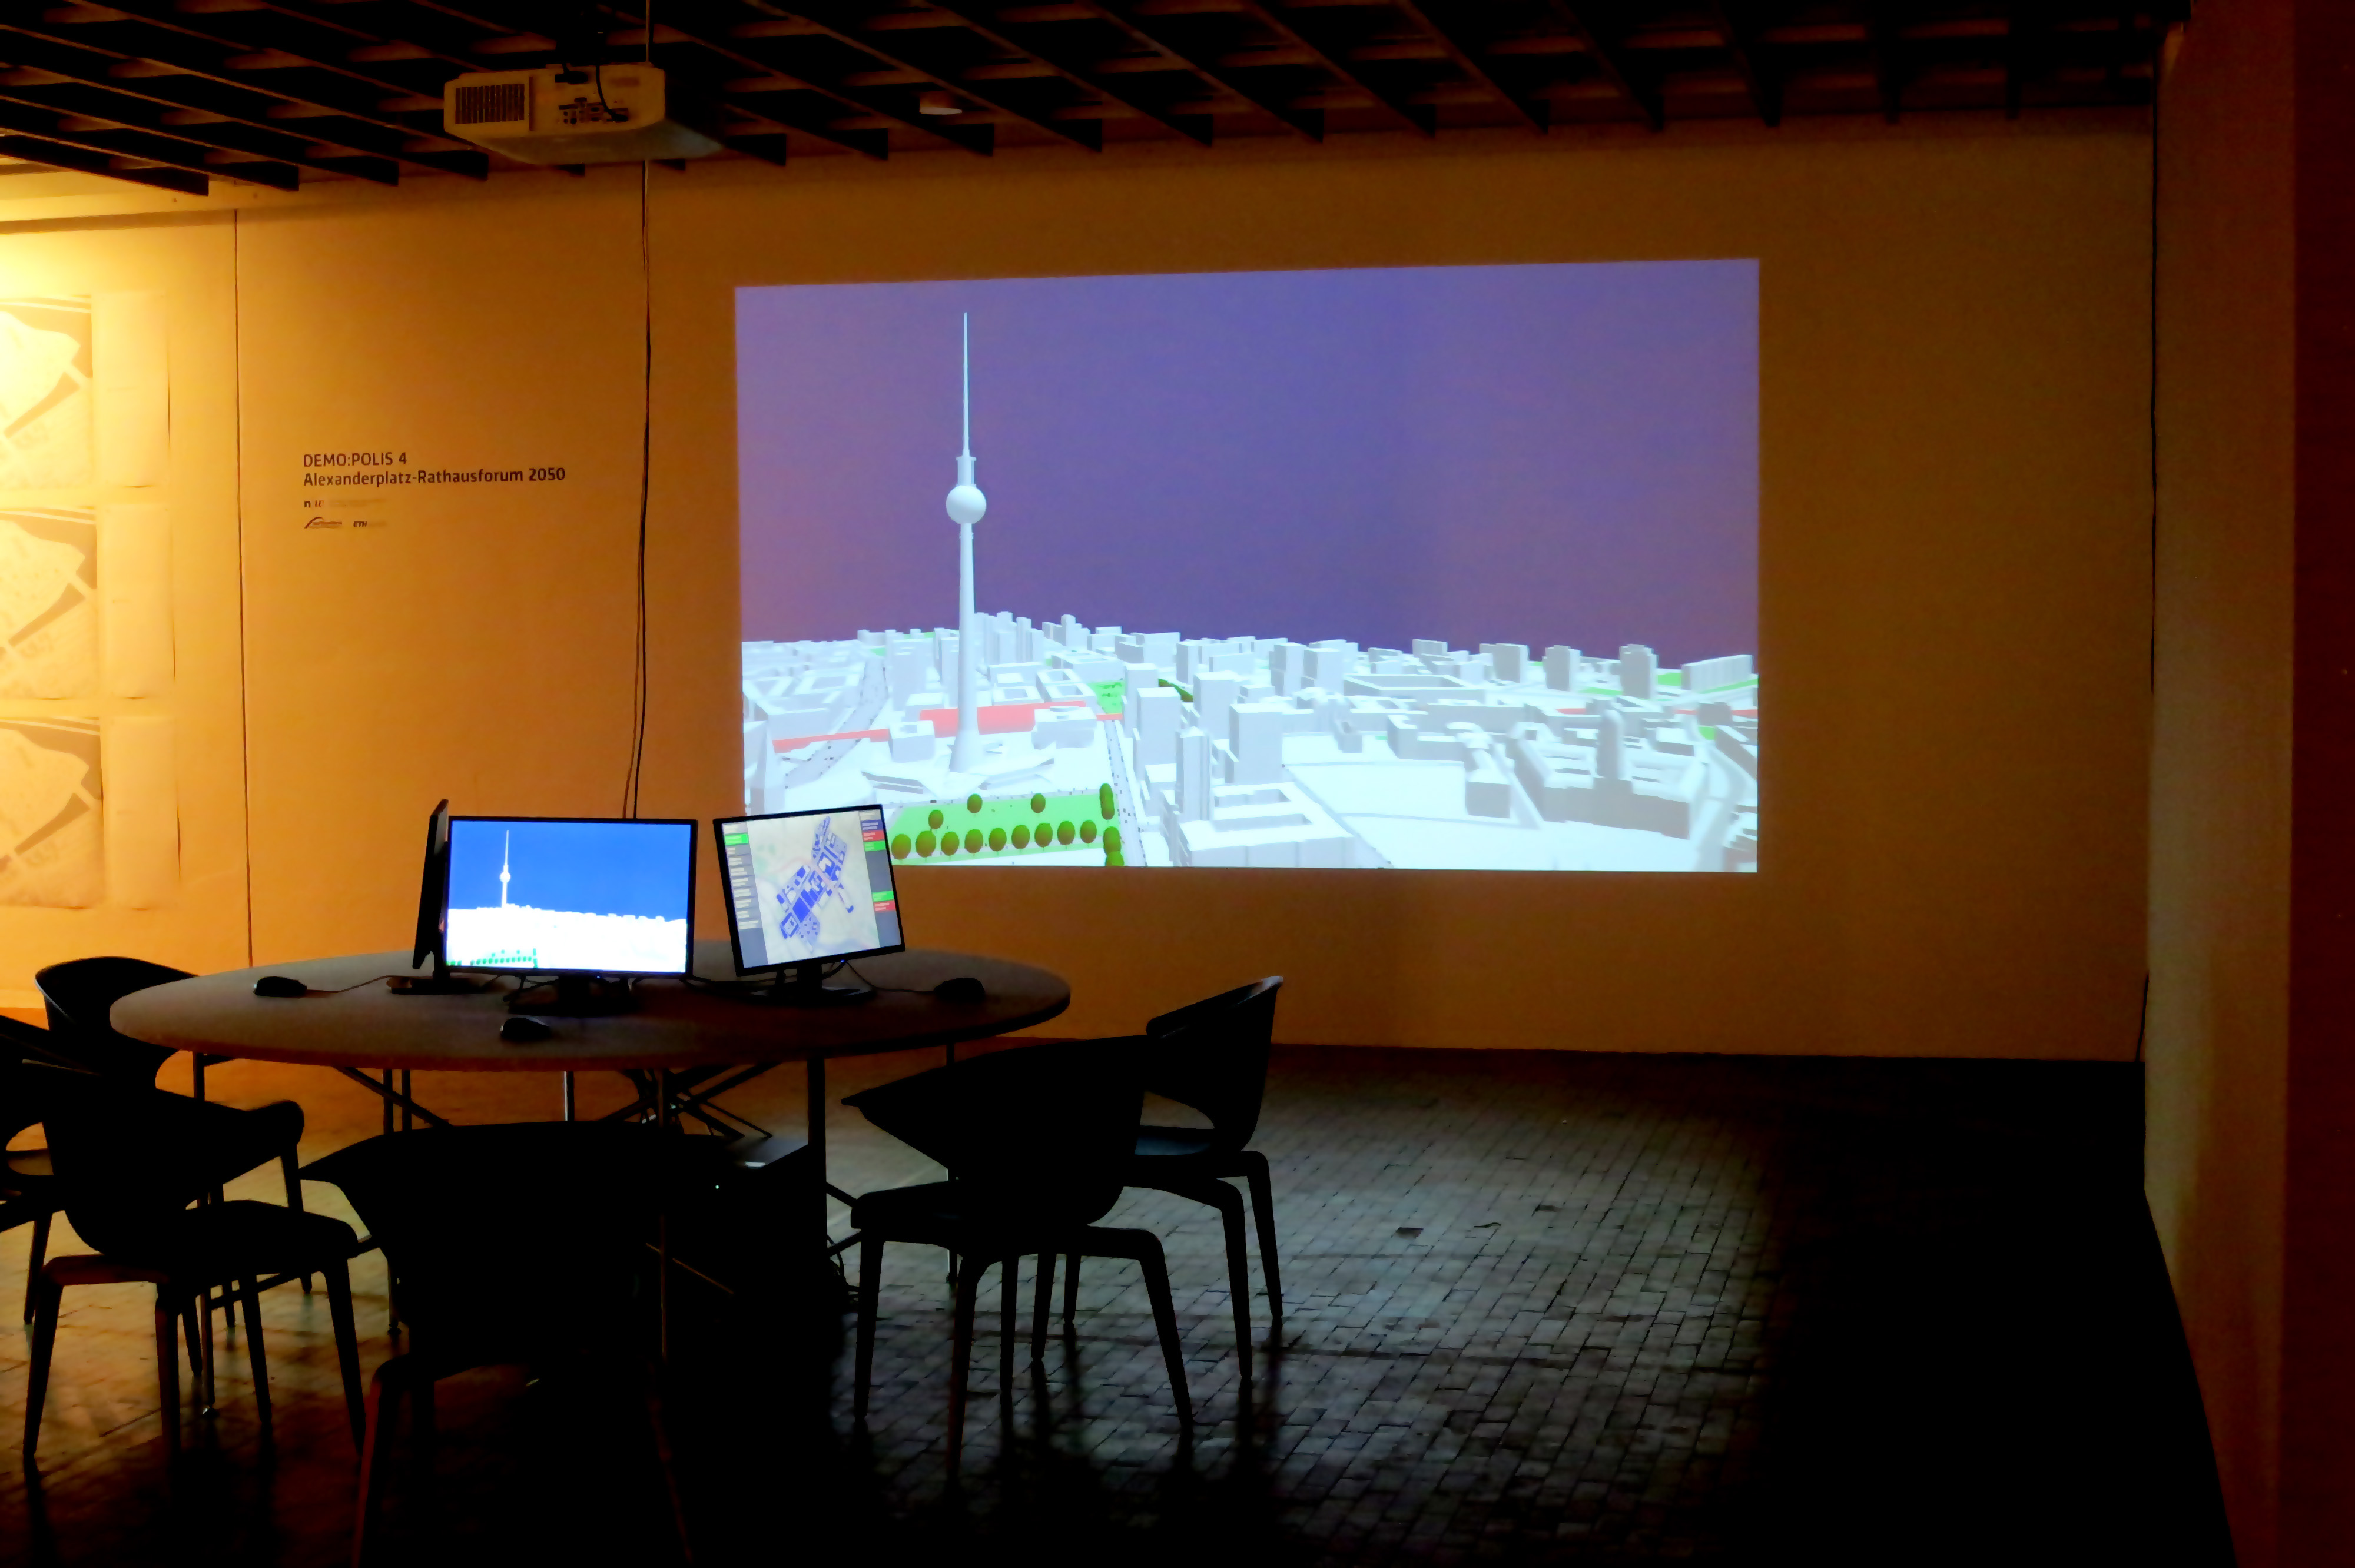
“Enabling DEMO:POLIS” is a participatory urban planning installation, presented as part of the DEMO:POLIS exhibition at the Berlin Akademie der Künste (https://www.adk.de/demopolis - 11.3.2016 - 29.5.2016). The installation engages the public in the design of open space and consists of six terminals that run a custom, interactive software application.
The software leads the user through a number of typical urban design tools (space allocation, streets, buildings, landscape, etc.) and concludes with a fly-through through the generated 3D scenario, in this case, the Rathausforum / Alexanderplatz area in Berlin.
The following video demonstrates a full cycle of a possible design.
Open Source
Source code, data and a binary build are available at: https://github.com/arisona
Credits
Concept: Stefan Arisona, Ruth Conroy Dalton, Christoph Hölscher, Wilfried Wang
Data & Coding: Stefan Arisona, Simon Schubiger, Zeng Wei
Support: Akademie der Künste Berlin, FHNW Switzerland (Institute of 4D Technologies), ETH Zürich (Future Cities Laboratory and Chair of Cognitive Science), Northumbria University (Architecture and Built Environment).
Data & Software Workflow
Enabling DEMO:POLIS builds on Open Data, in particular the publicly available 3D models of central Berlin provided by the Staatssenat für Stadtentwicklung und Umwelt (https://www.stadtentwicklung.berlin.de/planen/stadtmodelle/))
The original 3D models were initially imported into Autodesk AutoCAD for layer selection and coordinate system adjustments, then imported into Autodesk Maya for data cleaning and corrections. In a final step the data was imported into Esri CityEngine for final data adjustments & cleaning, merging, labelling, etc. The data was then exported as OBJs. The software application is written in Java, based on the 3D graphics library/engine ether. As indicated above, all source code and data is available as open source.
Visualizing Waypoints-Constrained Origin-Destination Patterns for Massive Transportation Data (CGF)
Journal: Computer Graphics Forum
Authors: Wei Zeng, Chi-Wing Fu, Stefan Arisona, Alexander Erath, Huamin Qu
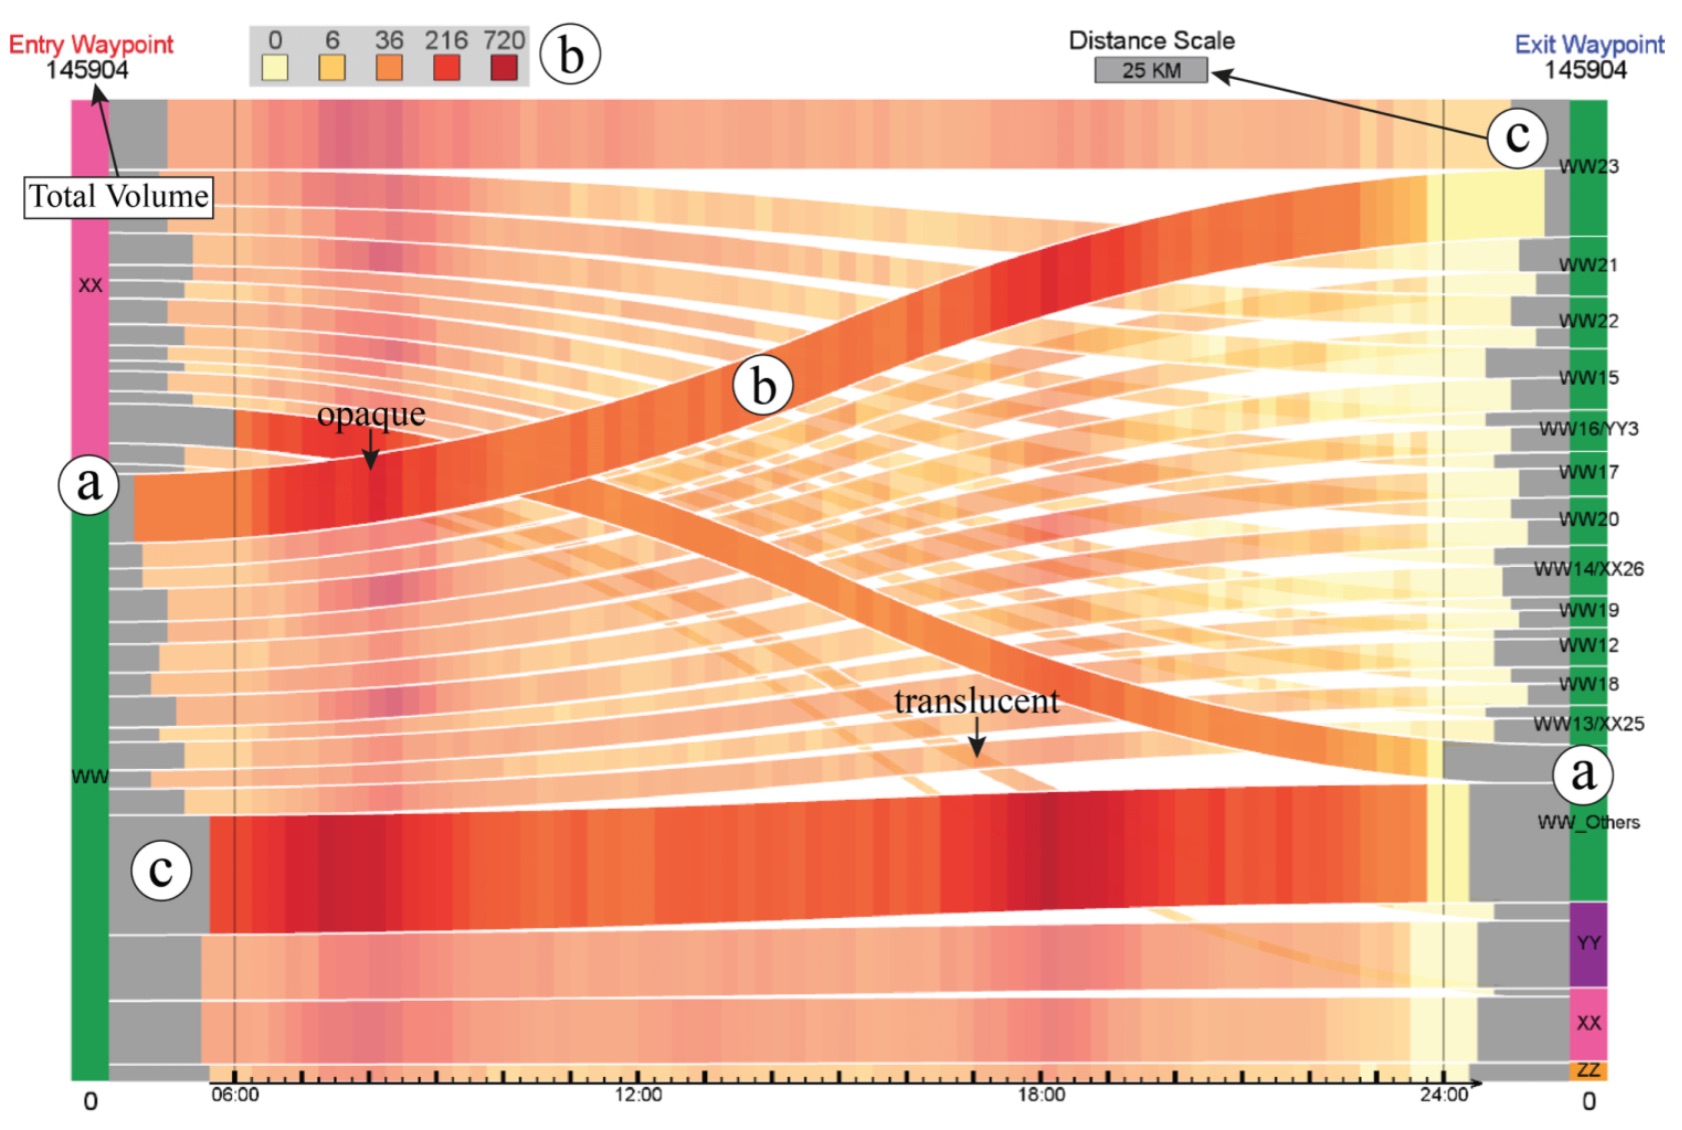
Abstract: Origin-destination (OD) pattern is a highly useful means for transportation research since it summarizes urban dynamics and human mobility. However, existing visual analytics are insufficient for certain OD analytical tasks needed in transport research. For example, transport researchers are interested in path-related movements across congested roads, besides global patterns over the entire domain. Driven by this need, we propose waypoints-constrained OD visual analytics, a new approach for exploring path-related OD patterns in an urban transportation network. First, we use hashing-based query to support interactive filtering of trajectories through user-specified waypoints. Second, we elaborate a set of design principles and rules, and derive a novel unified visual representation called the waypoints-constrained OD view by carefully considering the OD flow presentation, the temporal variation, spatial layout and user interaction. Finally, we demonstrate the effectiveness of our interface with two case studies and expert interviews with five transportation experts.
Title: Visualizing Waypoints-Constrained Origin-Destination Patterns for Massive Transportation Data
Authors: Wei Zeng, Chi-Wing Fu, Stefan Arisona, Alexander Erath, Huamin Qu
Journal: Computer Graphics Forum
Publisher: Eurographics Association
Year: 2015
Link: https://dx.doi.org/10.1111/cgf.12778
Revealing Centrality in the Spatial Structure of Cities from Human Activity Patterns (Urban Studies)
Journal: Urban Studies
Authors: Chen Zhong, Markus Schläpfer, Stefan Arisona, Michael Batty, Carlo Ratti, Gerhard Schmitt
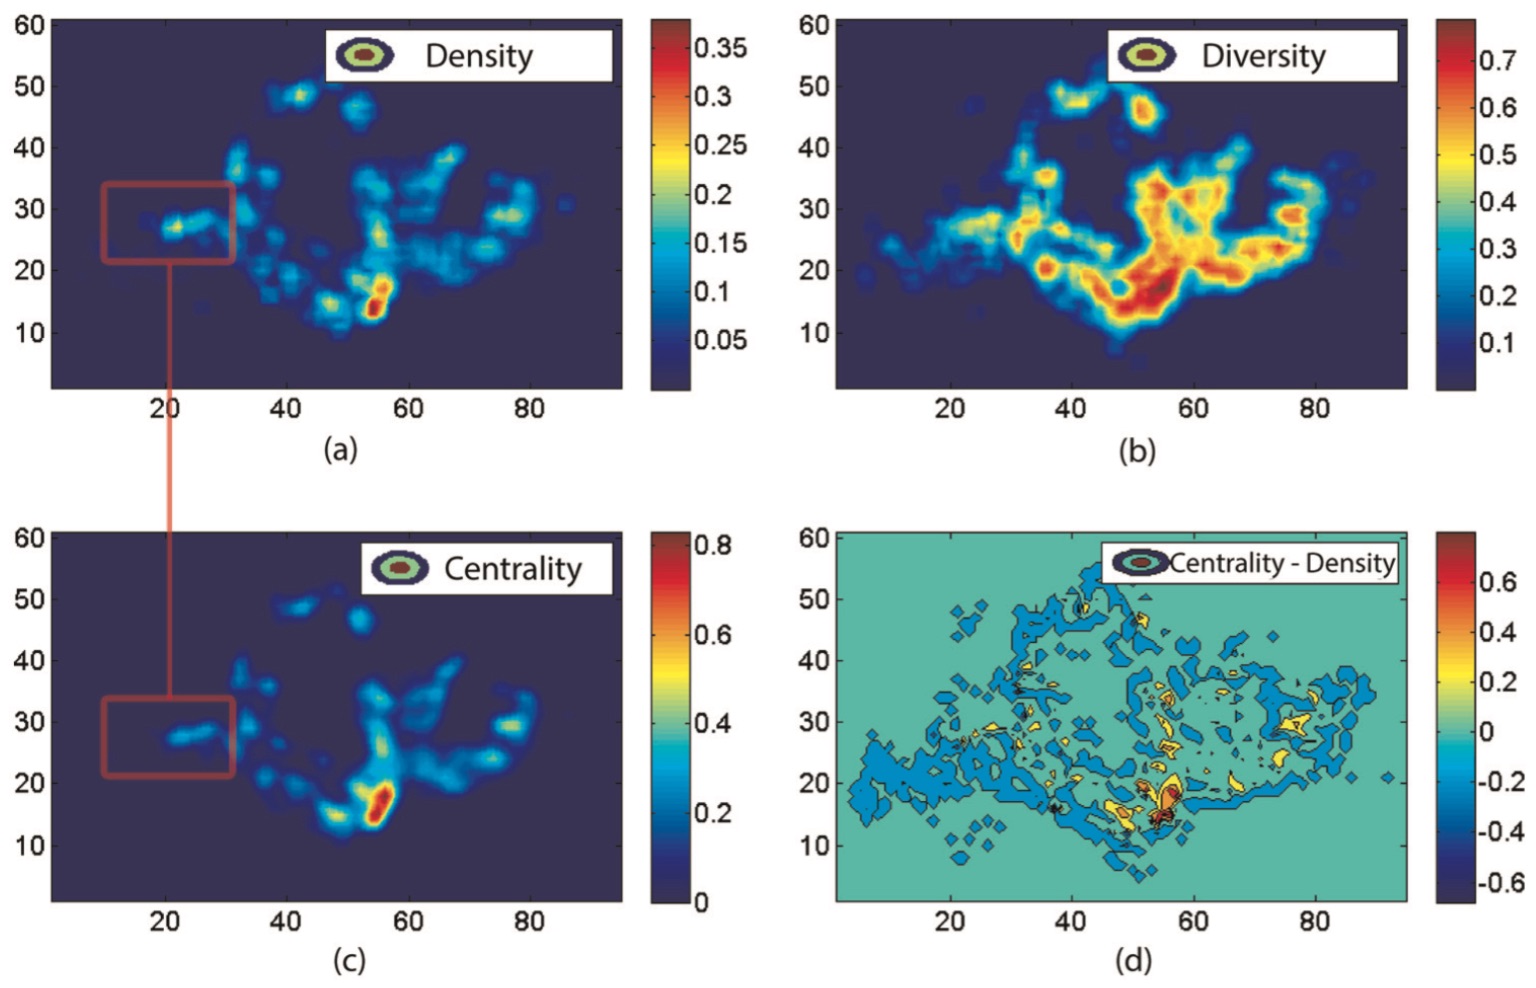
Abstract: Identifying changes in the spatial structure of cities is a prerequisite for the development and vali- dation of adequate planning strategies. Nevertheless, current methods of measurement are becoming ever more challenged by the highly diverse and intertwined ways of how people actually make use of urban space. Here, we propose a new quantitative measure for the centrality of locations, taking into account not only the numbers of people attracted to different locations, but also the diversity of the activities they are engaged in. This ‘centrality index’ allows for the identifi- cation of functional urban centres and for a systematic tracking of their relative importance over time, thus contributing to our understanding of polycentricity. We demonstrate the proposed index using travel survey data in Singapore for different years between 1997 and 2012. It is shown that, on the one hand, the city-state has been developing rapidly towards a polycentric urban form that compares rather closely with the official urban development plan. On the other hand, however, the downtown core has strongly gained in its importance, and this can be partly attrib- uted to the recent extension of the public transit system.
Title: Time-Space Diagram Revisited
Authors: Chen Zhong, Markus Schläpfer, Stefan Arisona, Michael Batty, Carlo Ratti, Gerhard Schmitt
Journal: Urban Studies
Publisher: Sage
Year: 2015
Link: https://dx.doi.org/10.1177/0042098015601599
Measuring Variability of Mobility Patterns from Multiday Smart-card Data (JOCS 2015)
Journal: Journal of Computational Science
Authors: Chen Zhong, Ed Manley, Stefan Arisona, Michael Batty, Gerhard Schmitt
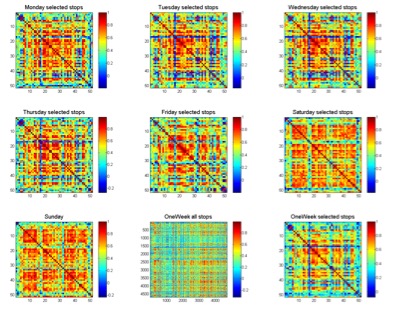
Abstract: The availability of large amounts of mobility data has stimulated the research in discovering patterns and understanding regularities. Comparatively, less attention has been paid to the study of variability, which, however, has been argued as equally important as regularities, since variability identifies diversity. In a transport network, variability exists from person to person, from place to place, and from day to day. In this paper, we present a set of measuring of variability at individual and aggregated levels using multi-day smart-card data. Statistical analysis, correlation matrix and network-based clustering methods are applied and potential use of measured results for urban applications are also discussed. We take Singapore as a case study and use one-week smart-card data for analysis. An interesting finding is that though the number of trips and mobility patterns varies from day to day, the overall spatial structure of urban movement always remains the same throughout a week. This finding showed that a systemic framework with well-organized analytical methods is indeed, necessary for extracting variability that may change at different levels and consequently for uncovering different aspects of dynamics, namely transit, social and urban dynamics. We consider this paper as a tentative work toward such generic framework for measuring variability and it can be used as a reference for other research work in such a direction.
Title: Time-Space Diagram Revisited
Authors: Chen Zhong, Ed Manley, Stefan Arisona, Michael Batty, Gerhard Schmitt
Journal: Journal of Computational Science
Publisher: Elsevier
Volume: 9
Year: 2015
Pages: 125 - 130
Link: https://dx.doi.org/10.1016/j.jocs.2015.04.021