
Tag: Visualization
17 posts tagged with "Visualization"
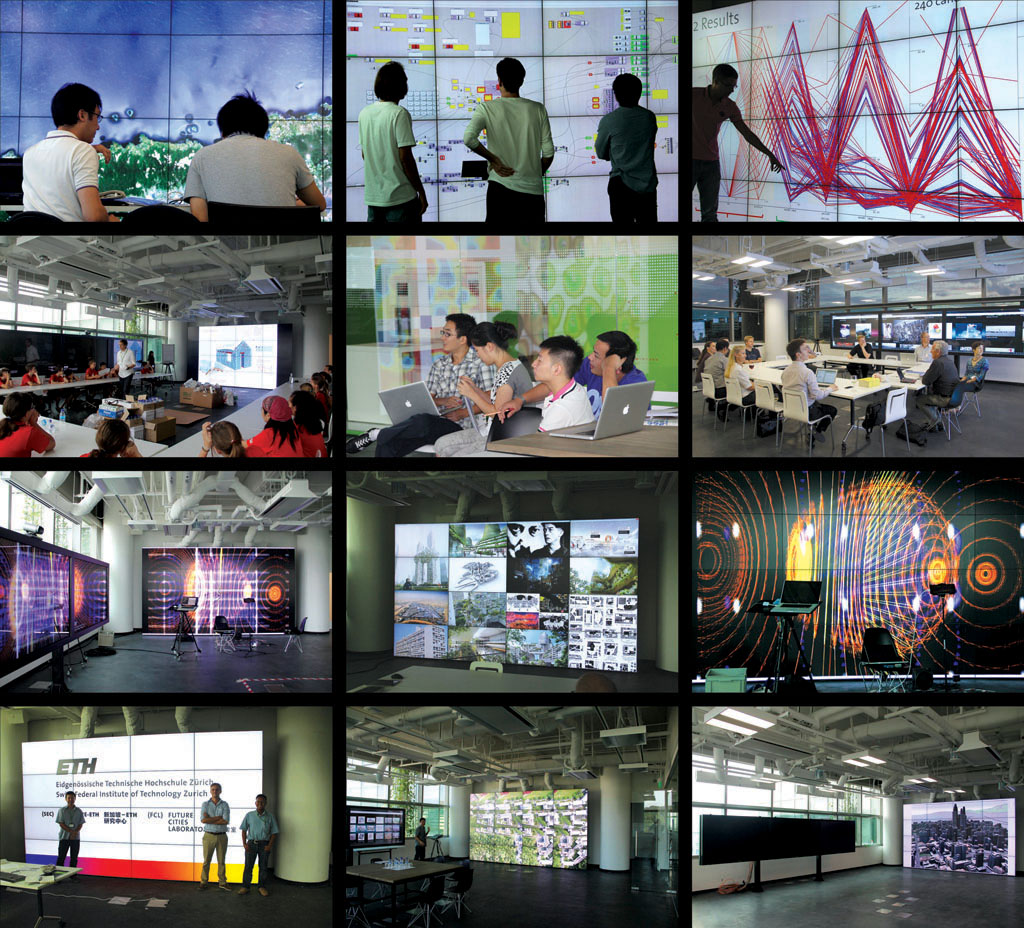
The Value Lab Asia
The Value Lab Asia is a collaborative, digitally augmented environment for a wide range of applications, such as participatory urban planning and design, stakeholder communication, information visualisation and discovery, remote teaching and conferencing. It includes a 33 megapixel video wall, three large displays with touch overlays, a number of smaller, mobile multi-touch enabled displays, and extensive video conferencing capabilities. The Value Lab Asia is the younger sibling of the Value Lab Zurich, built at ETH Zurich’s ScienceCity by Gerhard Schmitt, Remo Burkhard, Jan Halatsch and Antje Kunze of the Chair of Information Architecture in 2007/08. It therefore borrows many of the concepts of the Value Lab Zurich, such as being set in a friendly environment that operates in daylight conditions, however comes with updated state-of-the-art hardware and a different look.
The Value Lab Asia was conceived in the second half of 2011, and built in only two months from January 2012 to March 2012. It has been in regular operation since then. We are currently working on a more extensive documentation. Below you find the basic technical specifications.
If you are interested in visiting and/or using the facility, please feel free to contact me at arisona@arch.ethz.ch
Brief Technical Specifications
- Video wall, 4.9 x 2.7m, running at native 7680 x 4320 resolution (roughly 33 megapixels), driven from a single machine. Therefore, most applications run out of the box.
- Display wall with three 82" multi-touch displays, also driven from a single machine.
- Several 40" mobile multi-touch units, including mini-PC, thus completely autonomous.
- Tandberg-based video conferencing with one fixed and one mobile camera. Can be flexibly configured to run on video wall as well as display wall.
- Integrated video recording and production.
Institution: ETH Zurich’s Future Cities Laboratory
Location: Singapore
Period: Since 2011
Project lead, concept, system specification: Stefan Arisona
Interior design: Stefan Arisona in collaboration with Plasmadesign
System integration: PAVE System Pte Ltd
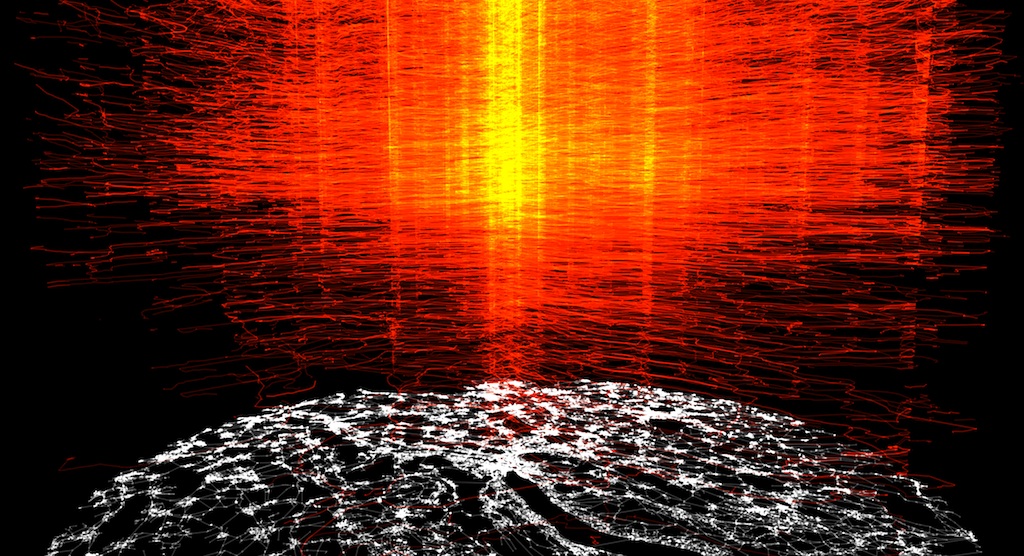
MetroBuzz: Interactive Visualization of Urban Transportation Data
Agent based simulation tools such as MATSim and MITSIM allow us to achieve efficient and accurate predictions of crowd behavior, thereby increasing our understanding of urban systems and assist in urban planning. However, output produced by such simulation platforms are difficult to communicate to stakeholders such as government agencies and the general public due to their technical nature.
In Project Metrobuzz we present a novel and visually striking method of displaying and interacting with large amounts of simulation data in a way that is both scientifically interesting as well as understandable for a broader audience. In order to achieve this, we generalised trip origin-destination information in terms of series of line segments in 3D space that allow spatiotemporal queries to quickly retrieve relevant data. In addition, we implemented interactive tools running on mobile devices (e.g. tablets) to define such queries in an intuitive manner.
W. Zeng, C. Zhong, A. Anwar, S. Arisona, and I. V. McLoughlin. 2012. MetroBuzz: Interactive 3D Visualization of Spatiotemporal Data. International Conference on Computer and Information Sciences (ICCIS), Kuala Lumpur, Turkey, June 12 – 14.
Project: Ongoing research, software prototype.
Institution: ETH Zurich’s Future Cities Laboratory
Location: Singapore
Period: Since 2011
Concept and programming: Stefan Arisona (ETH Zurich)
Programming: Zeng Wei (NTU), Afian Anwar (MIT), Christian Schneider (ETH Zurich)
Acknowledgments: Kay Axhausen and Alex Erath of the Future Cities Laboratory’s Mobility and Transportation group for providing the base data