Tag Archives: Featured

Book: Live Visuals – History, Theory, Practice

Edited by: Steve Gibson, Stefan Arisona, Donna Leishman and Atau Tanaka, 2022

From the publisher:

This volume surveys the key histories, theories and practice of artists, musicians, filmmakers, designers, architects and technologists that have worked and continue to work with visual material in real time.

Covering a wide historical period from Pythagoras’s mathematics of music and colour in ancient Greece, to Castel’s ocular harpsichord in the 18th century, to the visual music of the mid-20th century, to the liquid light shows of the 1960s and finally to the virtual reality and projection mapping of the present moment, Live Visuals is both an overarching history of real-time visuals and audio-visual art and a crucial source for understanding the various theories about audio-visual synchronization. With the inclusion of an overview of various forms of contemporary practice in Live Visuals culture – from VJing to immersive environments, architecture to design – Live Visuals also presents the key ideas of practitioners who work with the visual in a live context.

This book will appeal to a wide range of scholars, students, artists, designers and enthusiasts. It will particularly interest VJs, DJs, electronic musicians, filmmakers, interaction designers and technologists.

Read more on the publishers site: https://www.routledge.com/Live-Visuals-History-Theory-Practice/Gibson-Arisona-Leishman-Tanaka/p/book/9781032252681

CityEngine 3D Building Models of Berlin Mitte

This github project contains a Esri CityEngine model with ground plane, streets, parcels and 3D models of Berlin Mitte (2x2km) based on the open data provided by Berlin’s Senatsverwaltung für Stadtentwicklung und Wohnen (https://www.stadtentwicklung.berlin.de/).

According to the copyright of the source data (see link above) you may use and modify this project as you like, but commercial use is prohibited.

The CityEngine project was originally created for a participatory urban planning application “Enabling DEMO:POLIS”, exhibited at the Berlin Academy of Arts in 2016. The source code for the application is available freely as well (see https://robotized.arisona.ch/enabling-demopolis/ for more information).

Compared to the source data, the 3D models in the CityEngine project have been cleaned up with great care (removing duplicate faces, fixing normals, merging vertices etc.). Thus, the model can easily be used for visualization, urban planning scenarios, etc.

Available at github: https://github.com/arisona/berlin_3d

Real-Time Snow Cover Simulation (Computers & Graphics)

Title: Real-time GIS-based Snow Cover Approximation and Rendering for Large Terrains

Journal: Computers & Graphics

Authors: Benjamin Neukom, Stefan Müller Arisona, Simon Schubiger

Abstract: Various terrain visualization techniques based on geographic information system (GIS) data already exist. One major drawback of existing visualizations is that they do not capture seasonal variations well. Besides vegetation variations, in colder areas this particularly also applies to snow cover. In this paper, we propose a real-time multi-scale snow cover approximation and visualization for large terrains. The computation runs on a large grid, calculates the snow/water equivalent based on precipitation data from a GIS and snowmelt based on a physically-based solar radiation calculation combined with a degree-day snowmelt approach using level of detail (LOD). The snow visualization is divided into two parts: Zero thickness snow cover textures are generated for distant views. For close up views the terrain’s height field is modified using displacement maps and tessellation to produce thick snow covers. The GPU-based data-parallel computation and the visualization run on the GPU in real-time on a modern desktop computer. The implementation is tested using a real area in the Swiss Alps, with a size of 14.16 by 12.88 km, a grid resolution of 222 × 206, and a time step of 1 h. We compare the rendered results spanning several months with a time series of photographs from webcams for visual accuracy.

Comparison of webcam images (left) of Zermatt with our simulation (right). Trees were placed by hand and the sun position was approximated from the webcam image. (A) Start of the computation on 12.10.2015 with only the initial snow visible. (B) The results on 18.10.2015 after the first snowfall. The snowline was accurately computed. (C) The results on 16.01.2016 after the first heavy snowfall with the whole scene covered in snow. (D) The results on 21.04.2016 with snow beginning to melt as the temperature rises.

Code for Unreal Engine (open source): https://github.com/bneukom/UnrealSnow

Title: Visualizing Waypoints-Constrained Origin-Destination Patterns for Massive Transportation Data
Authors: Benjamin Neukom, Stefan Müller Arisona, Simon Schubiger
Journal: Computers & Graphics
Publisher: Elsevier
Year: 2018
Link: https://doi.org/10.1016/j.cag.2017.10.003

Lego Ableton Push Stand

Here’s a little fun my son Romeo and I had during school holidays: A Lego stand for Ableton push. Inspired by the awesome Lego DJ Booth recently posted here. Our brick collection’s a bit more limited tough.

Amazingly, the Push perfectly fits into the Lego raster. Coincidence, Ableton engineers / designers?

Next step, make it height adjustable, etc. – and – use it!

Lego Push Lego Push Lego Push

Enabling DEMO:POLIS

“Enabling DEMO:POLIS” is a participatory urban planning installation, presented as part of the DEMO:POLIS exhibition at the Berlin Akademie der Künste (http://www.adk.de/demopolis – 11.3.2016 – 29.5.2016). The installation engages the public in the design of open space and consists of six terminals that run a custom, interactive software application.

The software leads the user through a number of typical urban design tools (space allocation, streets, buildings, landscape, etc.) and concludes with a fly-through through the generated 3D scenario, in this case, the Rathausforum / Alexanderplatz area in Berlin.

The following video demonstrates a full cycle of a possible design.

Contact

Stefan Arisona – https://robotized.arisona.ch

Open Source

Source code, data and a binary build are available at: http://github.com/arisona

Credits

Concept: Stefan Arisona, Ruth Conroy Dalton, Christoph Hölscher, Wilfried Wang

Data & Coding: Stefan Arisona, Simon Schubiger, Zeng Wei

Support: Akademie der Künste Berlin, FHNW Switzerland (Institute of 4D Technologies), ETH Zürich (Future Cities Laboratory and Chair of Cognitive Science), Northumbria University (Architecture and Built Environment).

Data & Software Workflow

Enabling DEMO:POLIS builds on Open Data, in particular the publicly available 3D models of central Berlin provided by the Staatssenat für Stadtentwicklung und Umwelt (http://www.stadtentwicklung.berlin.de/planen/stadtmodelle/)

The original 3D models were initially imported into Autodesk AutoCAD for layer selection and coordinate system adjustments, then imported into Autodesk Maya for data cleaning and corrections. In a final step the data was imported into Esri CityEngine for final data adjustments & cleaning, merging, labelling, etc. The data was then exported as OBJs. The software application is written in Java, based on the 3D graphics library/engine ether. As indicated above, all source code and data is available as open source.

The Wild Jewels

Exhibition at the Institute for the Future (IFTF), Palo Alto, 21 September 2015 – 15 April 2016 as part of the Apocalypse Exhibition by Catherine Young
Pre-opening at swissnex San Francisco, 19 September 2015

Stefan Arisona, Simon Schubiger, Ika Arisona
In collaboration with Catherine Young

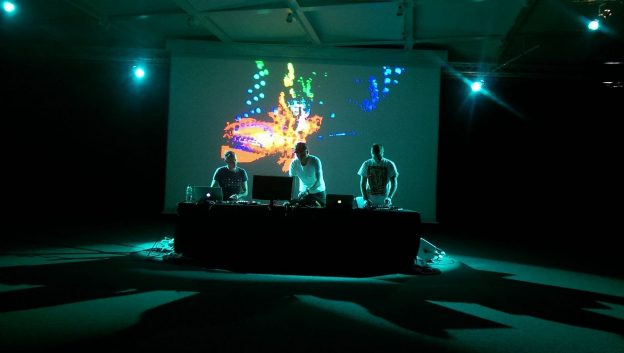
The Wild Jewels explore the possibilities of data-driven wearable technology that responds to future environmental scenarios. The pieces make use of data provided by millions of sensors and mobile phones that permanently collect data of the momentary state of a city; and in addition expand the scale to include solar activity data collected from observatories and probes in space.

The collection is inspired by large data analysis and collaboration facilities such as the Value Lab Asia, and it demonstrates typical modes of interaction with data: visualizing, filtering, projecting and connecting in a different context. Thereby, the pieces freely re-interpret and embody these modes, and bring them to a small, personal scale. The functional aspect is combined with precious materials and traditional jewelry and accessory designs, ultimately to be worn as pretty artworks.

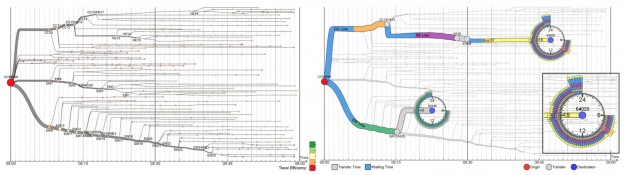
Raumwetter (Space Weather Orb)

Raumwetter is a necklace that visualizes the beauty of space weather: The sun permanently releases streams of hot gas into space – the solar wind. A solar flare may blast millions of tons of matter into space, turning the wind into a storm reaching speeds of up to 2 million miles per hour. Luckily, on earth we are protected. Earth’s magnetic field redirects most charged solar particles to flow around the planet. However, space based technology (GPS), communication systems and power grids may be at risk. Thus, Raumwetter also has the capability to warn you of intense solar events.

The Wild Jewels: Raumwetter

Raumwetter: Machine-cut acrylic; “patate di mare”; gold wire; transparent acrylic sphere, lit with pico-projector from inside.

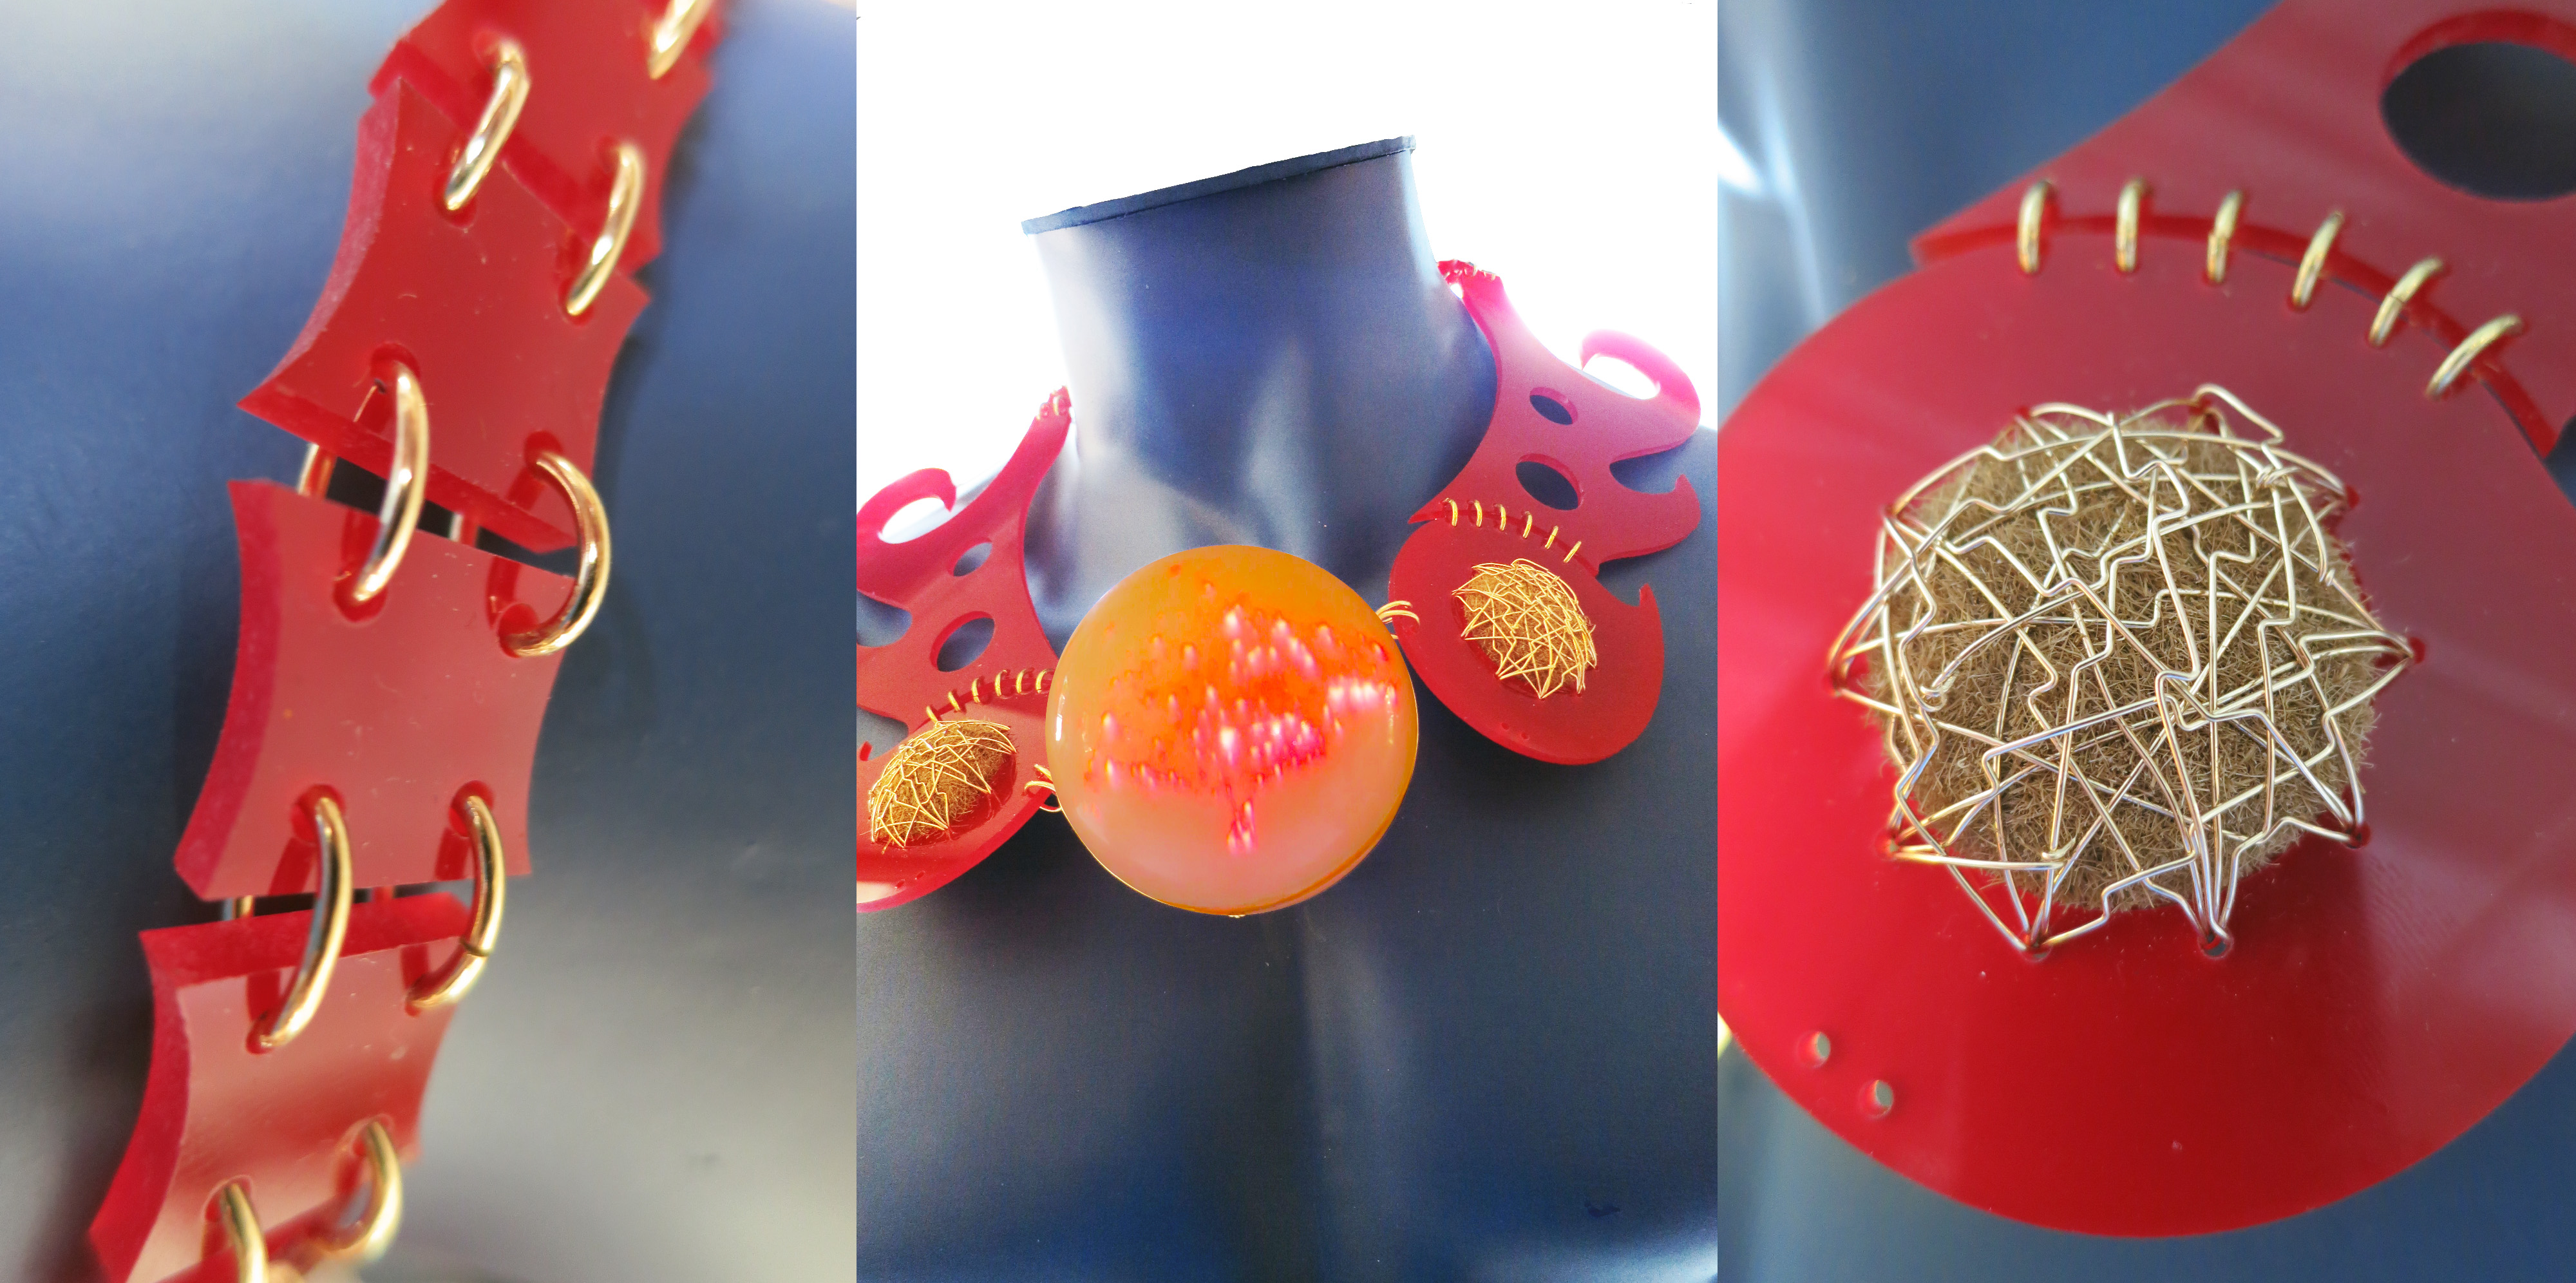
Giftschleuse (Poison Gate Cuff)

On Earth, 780 million people do not have access to clean water, and in the near future, availability of water is expected to decrease in many regions. Giftschleuse is a water filtering bangle that can be worn at all times. It provides instant, clean water. Similarly to an exo-skeleton, it is an exo-organ that provides additional functions to the human body in situations where our own organism cannot deal with conditions such as polluted water. In addition, it maps areas of clean water and shares the data with other water-seekers nearby.

The Wild Jewels: Giftschleuse

Giftschleuse: Machine cut brass, silicon pipes, coloured cooling liquid, electrical pumps.

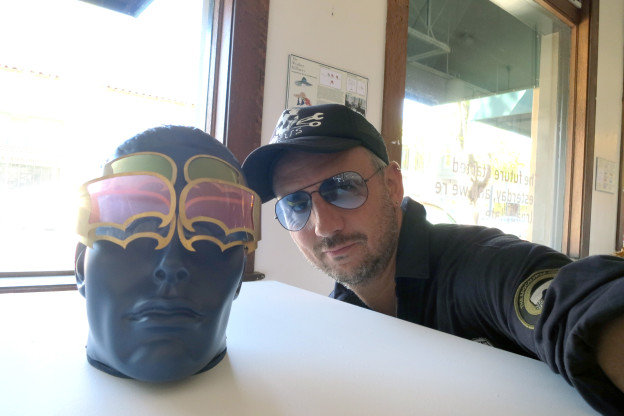
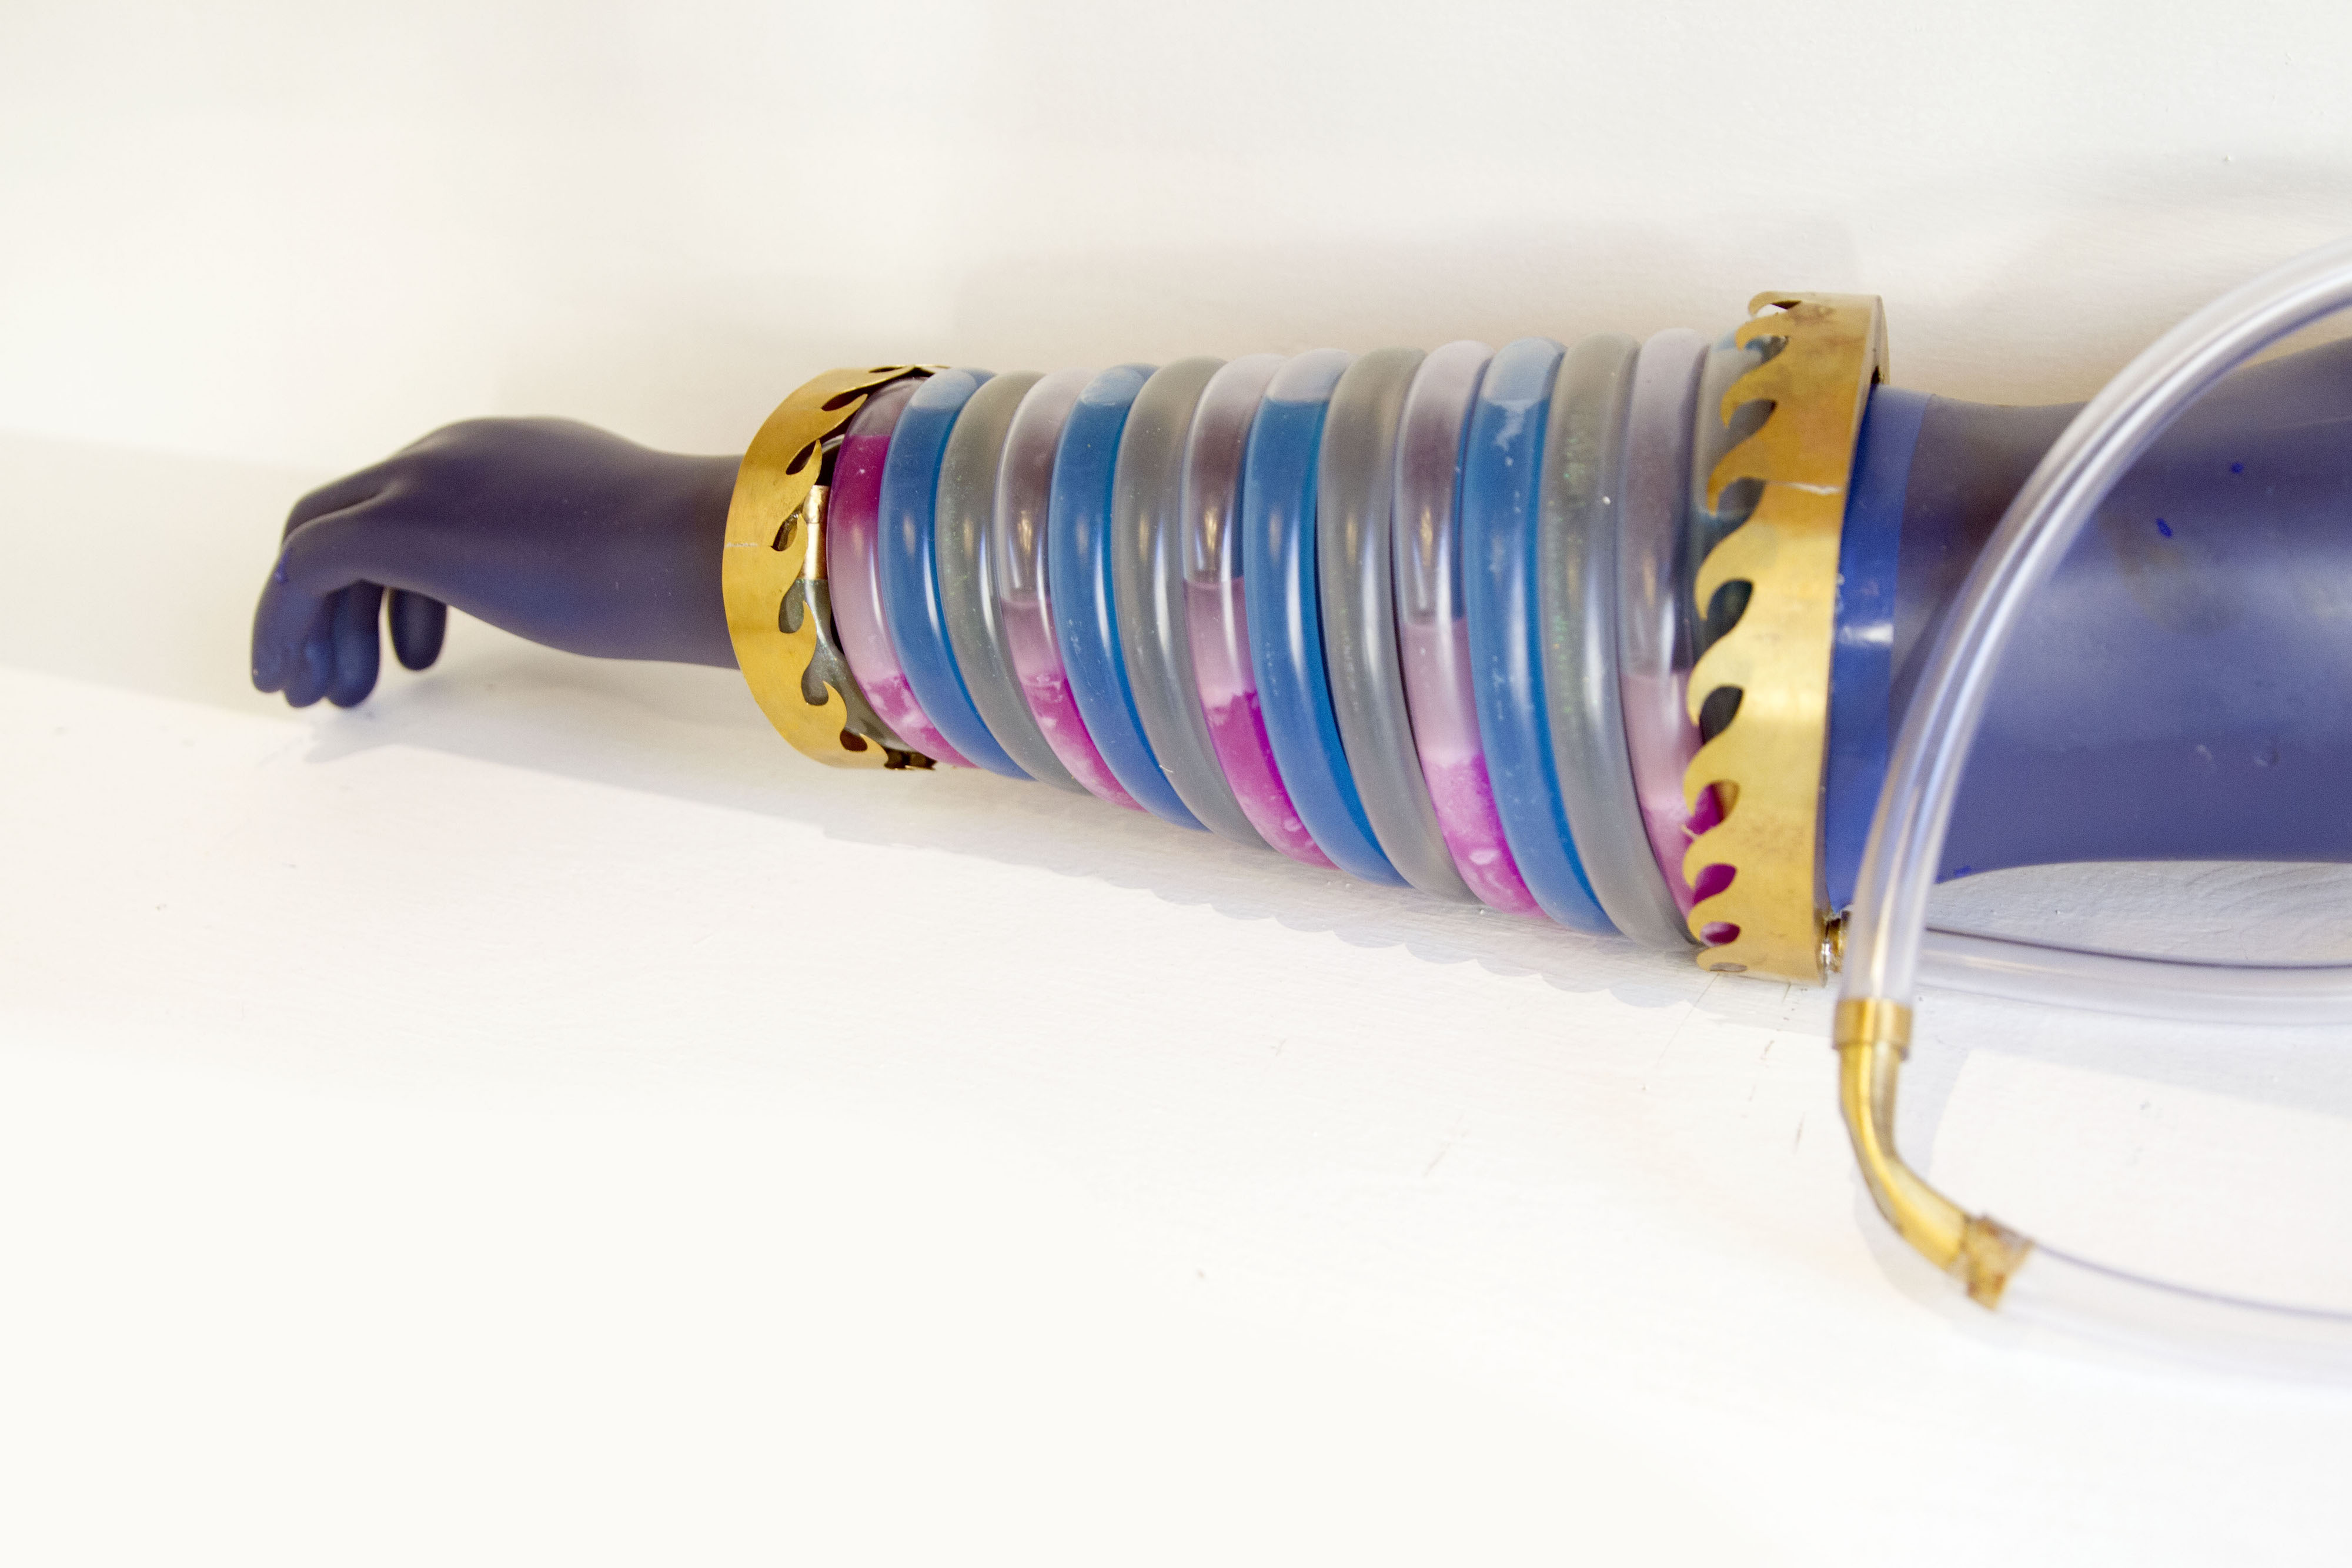
Durchblick (Clear Vision Goggles)

Besides correcting your seeing capabilities and protecting your eyes from strong light, Durchblick is a multifunctional display device that allows you to project the invisible into your visual perception: Depending on its configuration, it provides hints about wireless communication networks, radiation, dust and more. These are the shades for a hotter planet!

The Wild Jewels: Durchblick

Durchblick: Machine-cut brass, acrylic glasses, motorised clock-work driving the shades.

Übergesund (Super Health Glove)

Übergesund is decorated glove and a social health device that builds spontaneous data networks with other wearers. It will inform you if somebody near you needs help, and it forwards such alerts to others around who might be able to help. In densely populated areas, such as in cities, Übergesund provides a decentralized health-network that allows for community-sourced services that are available at a high response time.

The Wild Jewels: Übergesund

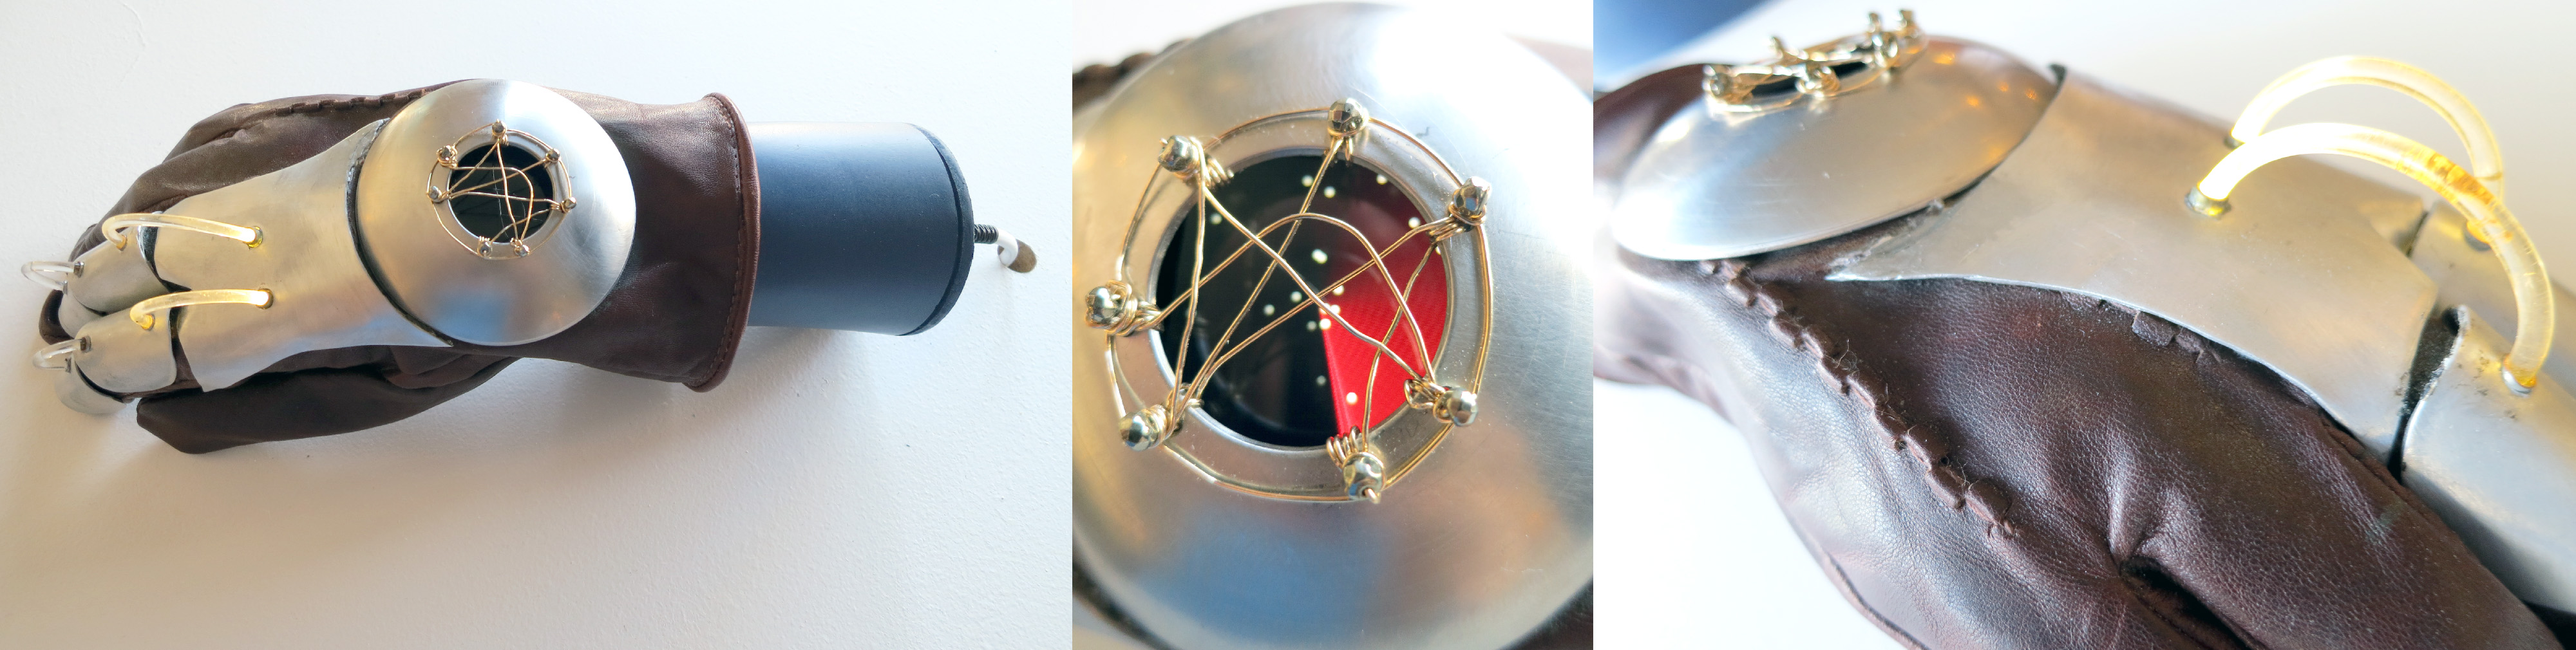
Übergesund: Cut, turned and brushed steel; gold wire; silicon LED strings; custom-programmed smart watch LCD display.

This work was supported by: ETH Zürich (ETH Global & Future Cities Laboratory), FHNW (Institute of 4D Technologies), Institute for the Future, swissnex San Francisco, Consulate General of Switzerland in San Francisco.

House of Futures Poster

The Fine Jewels

More infos on the Apocalypse Project: http://apocalypse.cc

Revealing Centrality in the Spatial Structure of Cities from Human Activity Patterns (Urban Studies)

Journal: Urban Studies

Authors: Chen Zhong, Markus Schläpfer, Stefan Müller Arisona, Michael Batty, Carlo Ratti, Gerhard Schmitt

Abstract: Identifying changes in the spatial structure of cities is a prerequisite for the development and vali- dation of adequate planning strategies. Nevertheless, current methods of measurement are becoming ever more challenged by the highly diverse and intertwined ways of how people actu- ally make use of urban space. Here, we propose a new quantitative measure for the centrality of locations, taking into account not only the numbers of people attracted to different locations, but also the diversity of the activities they are engaged in. This ‘centrality index’ allows for the identifi- cation of functional urban centres and for a systematic tracking of their relative importance over time, thus contributing to our understanding of polycentricity. We demonstrate the proposed index using travel survey data in Singapore for different years between 1997 and 2012. It is shown that, on the one hand, the city-state has been developing rapidly towards a polycentric urban form that compares rather closely with the official urban development plan. On the other hand, however, the downtown core has strongly gained in its importance, and this can be partly attrib- uted to the recent extension of the public transit system.

Title: Time-Space Diagram Revisited
Authors: Chen Zhong, Markus Schläpfer, Stefan Müller Arisona, Michael Batty, Carlo Ratti, Gerhard Schmitt
Journal: Urban Studies
Publisher: Sage
Year: 2015
Link: https://dx.doi.org/10.1177/0042098015601599

Visualizing Mobility of Public Transportation System (TVCG/VAST)

Journal: IEEE Transactions on Visualization and Computer Graphics (TVCG).

Conference: IEEE Visual Analytics Science and Technology (VAST) 2014.

Authors: Wei Zeng, Chi-Wing Fu, Stefan Müller Arisona, Alexander Erath, Huamin Qu

Abstract: Public transportation systems (PTSs) play an important role in modern cities, providing shared/massive transportation services that are essential for the general public. However, due to their increasing complexity, designing effective methods to visualize and explore PTS is highly challenging. Most existing techniques employ network visualization methods and focus on showing the network topology across stops while ignoring various mobility-related factors such as riding time, transfer time, waiting time, and round-the-clock patterns. This work aims to visualize and explore passenger mobility in a PTS with a family of analytical tasks based on inputs from transportation researchers. After exploring different design alternatives, we come up with an integrated solution with three visualization modules: isochrone map view for geographical information, isotime flow map view for effective temporal information comparison and manipulation, and OD-pair journey view for detailed visual analysis of mobility factors along routes between specific origin-destination pairs. The isotime flow map linearizes a flow map into a parallel isoline representation, maximizing the visualization of mobility information along the horizontal time axis while presenting clear and smooth pathways from origin to destinations. Moreover, we devise several interactive visual query methods for users to easily explore the dynamics of PTS mobility over space and time. Lastly, we also construct a PTS mobility model from millions of real passenger trajectories, and evaluate our visualization techniques with assorted case studies with the transportation researchers.

Title: Visualizing Mobility of Public Transportation System
Authors: Wei Zeng, Chi-Wing Fu, Stefan Müller Arisona, Alexander Erath, Huamin Qu
Journal: IEEE TVCG
Publisher: IEEE
Volume: 20(12)
Year: 2014
Pages: 1833 – 1842
Link: http://dx.doi.org/10.1109/TVCG.2014.2346893