Tag Archives: Visualization

Real-Time Snow Cover Simulation (Computers & Graphics)

Title: Real-time GIS-based Snow Cover Approximation and Rendering for Large Terrains

Journal: Computers & Graphics

Authors: Benjamin Neukom, Stefan Müller Arisona, Simon Schubiger

Abstract: Various terrain visualization techniques based on geographic information system (GIS) data already exist. One major drawback of existing visualizations is that they do not capture seasonal variations well. Besides vegetation variations, in colder areas this particularly also applies to snow cover. In this paper, we propose a real-time multi-scale snow cover approximation and visualization for large terrains. The computation runs on a large grid, calculates the snow/water equivalent based on precipitation data from a GIS and snowmelt based on a physically-based solar radiation calculation combined with a degree-day snowmelt approach using level of detail (LOD). The snow visualization is divided into two parts: Zero thickness snow cover textures are generated for distant views. For close up views the terrain’s height field is modified using displacement maps and tessellation to produce thick snow covers. The GPU-based data-parallel computation and the visualization run on the GPU in real-time on a modern desktop computer. The implementation is tested using a real area in the Swiss Alps, with a size of 14.16 by 12.88 km, a grid resolution of 222 × 206, and a time step of 1 h. We compare the rendered results spanning several months with a time series of photographs from webcams for visual accuracy.

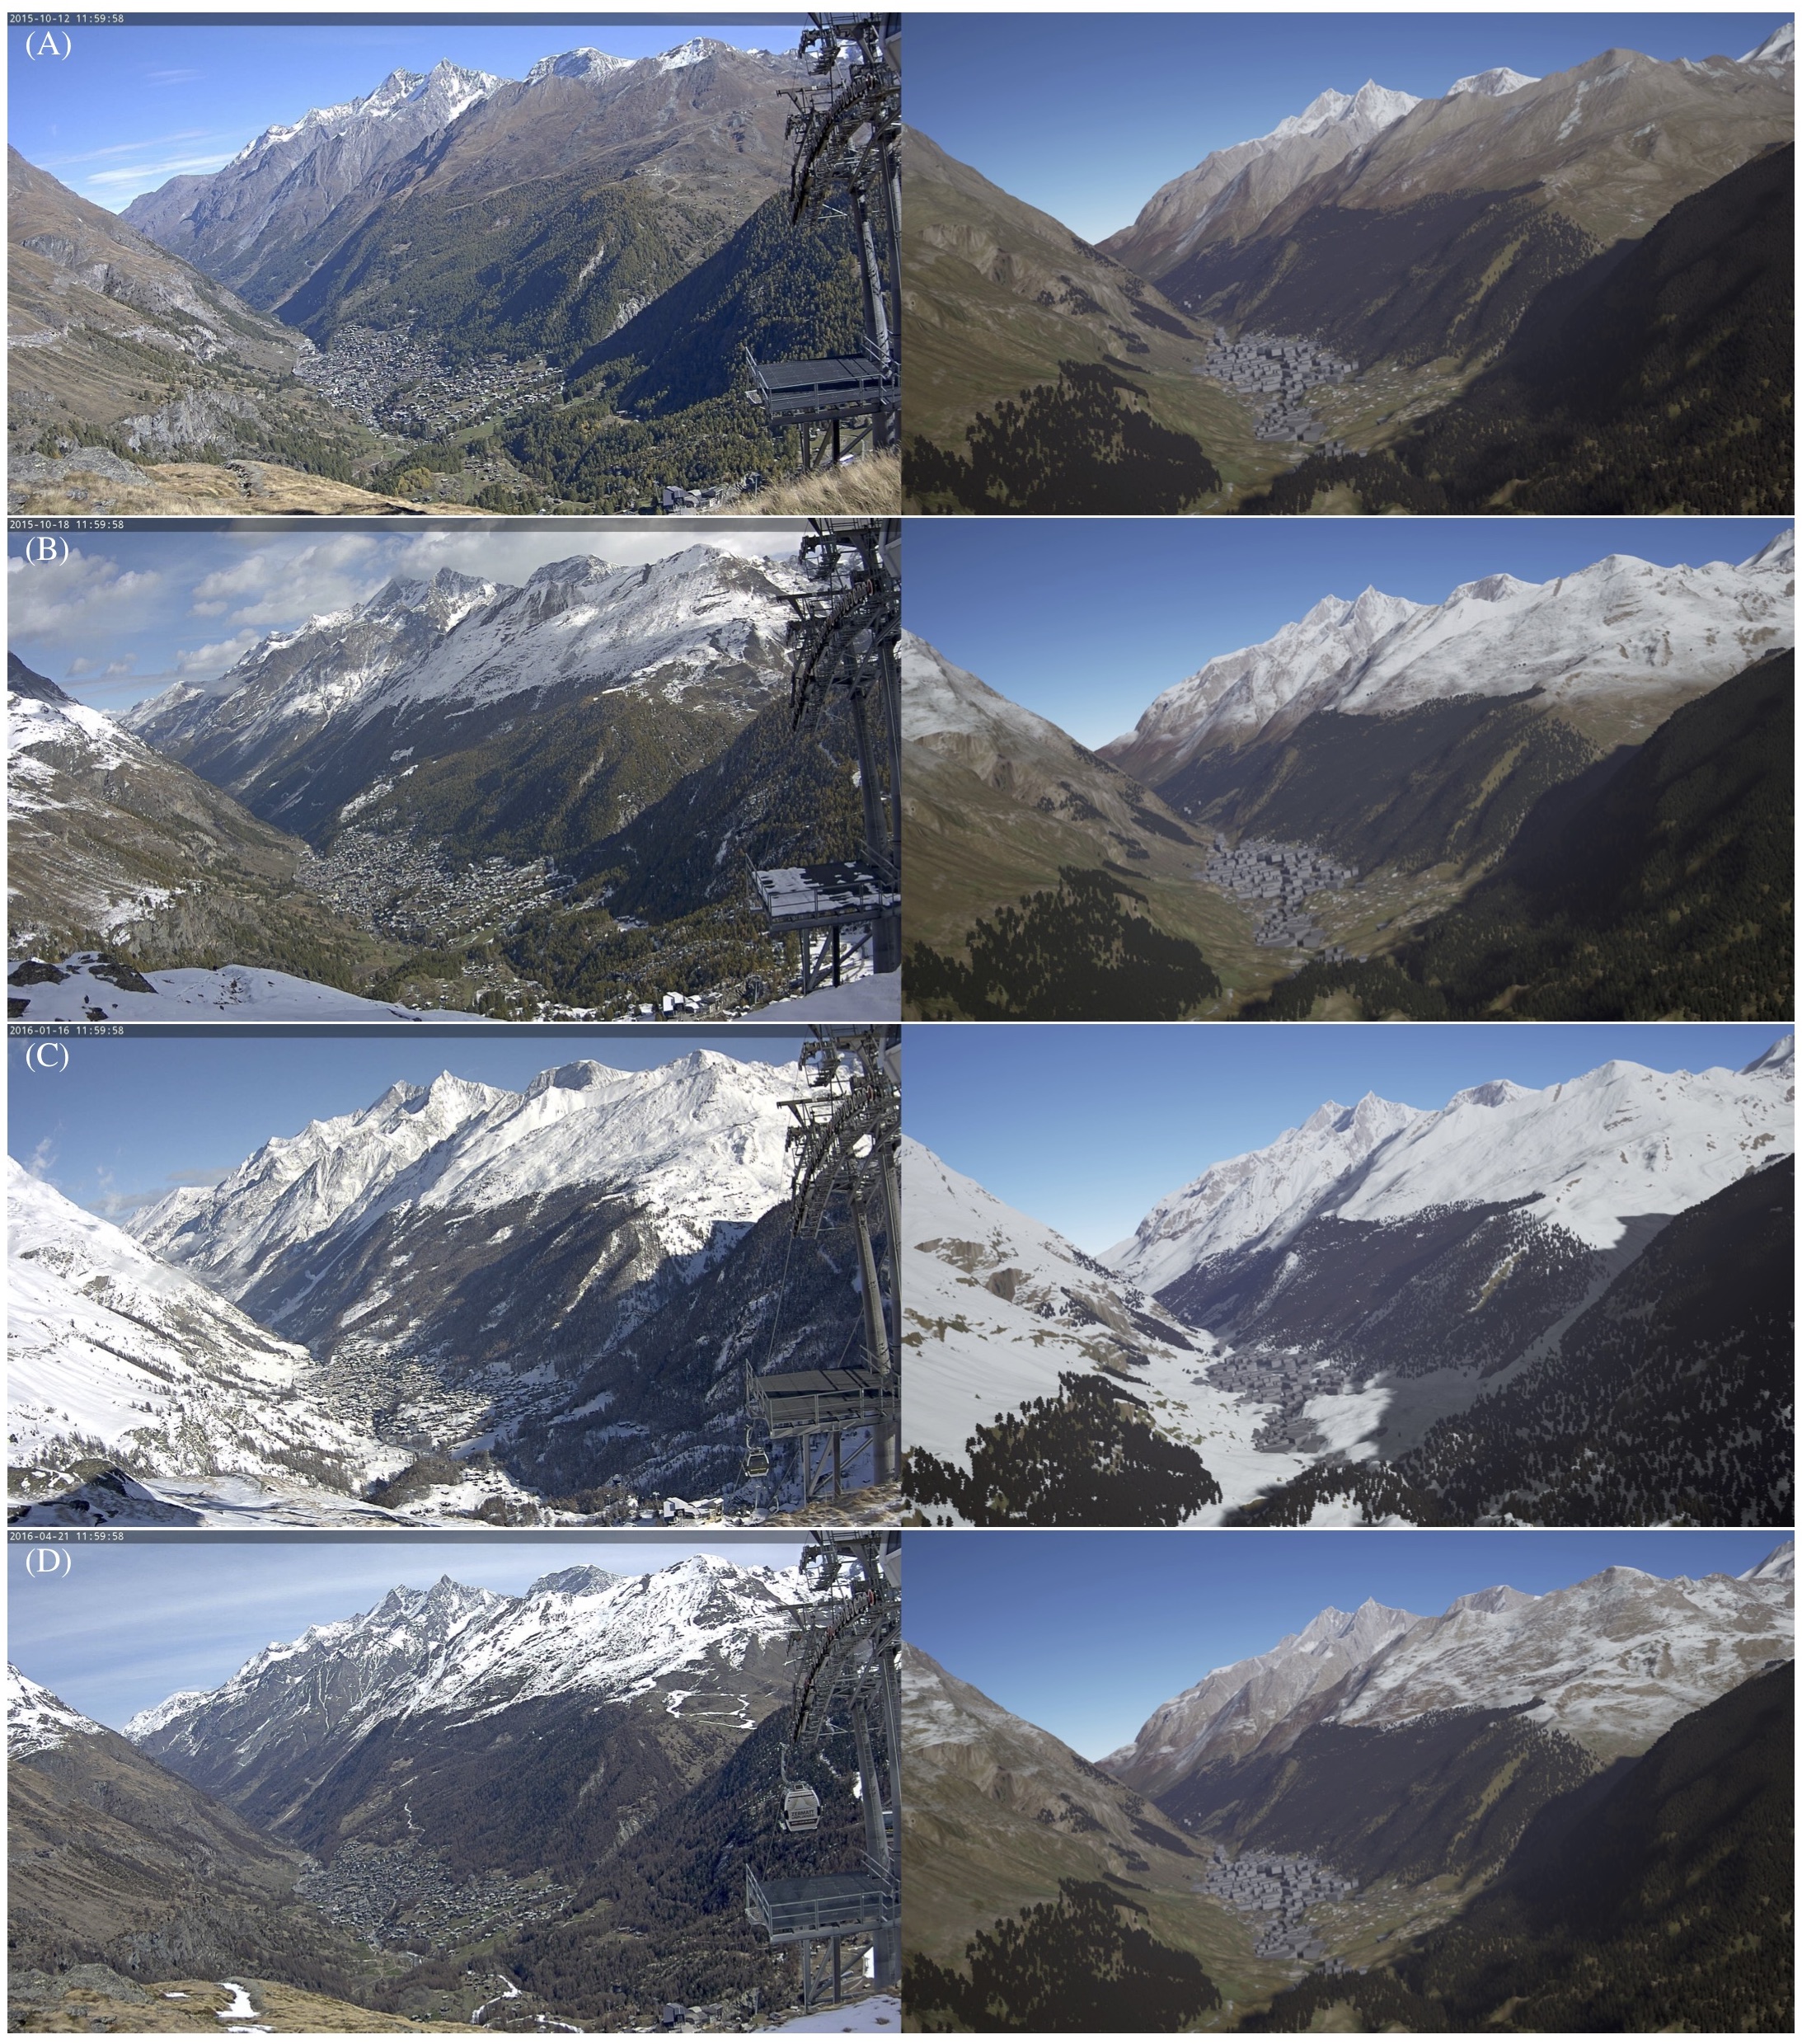
Comparison of webcam images (left) of Zermatt with our simulation (right). Trees were placed by hand and the sun position was approximated from the webcam image. (A) Start of the computation on 12.10.2015 with only the initial snow visible. (B) The results on 18.10.2015 after the first snowfall. The snowline was accurately computed. (C) The results on 16.01.2016 after the first heavy snowfall with the whole scene covered in snow. (D) The results on 21.04.2016 with snow beginning to melt as the temperature rises.

Code for Unreal Engine (open source): https://github.com/bneukom/UnrealSnow

Title: Visualizing Waypoints-Constrained Origin-Destination Patterns for Massive Transportation Data
Authors: Benjamin Neukom, Stefan Müller Arisona, Simon Schubiger
Journal: Computers & Graphics
Publisher: Elsevier
Year: 2018
Link: https://doi.org/10.1016/j.cag.2017.10.003

Enabling DEMO:POLIS

“Enabling DEMO:POLIS” is a participatory urban planning installation, presented as part of the DEMO:POLIS exhibition at the Berlin Akademie der Künste (http://www.adk.de/demopolis – 11.3.2016 – 29.5.2016). The installation engages the public in the design of open space and consists of six terminals that run a custom, interactive software application.

The software leads the user through a number of typical urban design tools (space allocation, streets, buildings, landscape, etc.) and concludes with a fly-through through the generated 3D scenario, in this case, the Rathausforum / Alexanderplatz area in Berlin.

The following video demonstrates a full cycle of a possible design.

Contact

Stefan Arisona – https://robotized.arisona.ch

Open Source

Source code, data and a binary build are available at: http://github.com/arisona

Credits

Concept: Stefan Arisona, Ruth Conroy Dalton, Christoph Hölscher, Wilfried Wang

Data & Coding: Stefan Arisona, Simon Schubiger, Zeng Wei

Support: Akademie der Künste Berlin, FHNW Switzerland (Institute of 4D Technologies), ETH Zürich (Future Cities Laboratory and Chair of Cognitive Science), Northumbria University (Architecture and Built Environment).

Data & Software Workflow

Enabling DEMO:POLIS builds on Open Data, in particular the publicly available 3D models of central Berlin provided by the Staatssenat für Stadtentwicklung und Umwelt (http://www.stadtentwicklung.berlin.de/planen/stadtmodelle/)

The original 3D models were initially imported into Autodesk AutoCAD for layer selection and coordinate system adjustments, then imported into Autodesk Maya for data cleaning and corrections. In a final step the data was imported into Esri CityEngine for final data adjustments & cleaning, merging, labelling, etc. The data was then exported as OBJs. The software application is written in Java, based on the 3D graphics library/engine ether. As indicated above, all source code and data is available as open source.

Visualizing Waypoints-Constrained Origin-Destination Patterns for Massive Transportation Data (CGF)

Journal: Computer Graphics Forum

Authors: Wei Zeng, Chi-Wing Fu, Stefan Müller Arisona, Alexander Erath, Huamin Qu

Abstract: Origin-destination (OD) pattern is a highly useful means for transportation research since it summarizes urban dynamics and human mobility. However, existing visual analytics are insufficient for certain OD analytical tasks needed in transport research. For example, transport researchers are interested in path-related movements across congested roads, besides global patterns over the entire domain. Driven by this need, we propose waypoints-constrained OD visual analytics, a new approach for exploring path-related OD patterns in an urban transportation network. First, we use hashing-based query to support interactive filtering of trajectories through user-specified waypoints. Second, we elaborate a set of design principles and rules, and derive a novel unified visual representation called the waypoints-constrained OD view by carefully considering the OD flow presentation, the temporal variation, spatial layout and user interaction. Finally, we demonstrate the effectiveness of our interface with two case studies and expert interviews with five transportation experts.

Title: Visualizing Waypoints-Constrained Origin-Destination Patterns for Massive Transportation Data
Authors: Wei Zeng, Chi-Wing Fu, Stefan Müller Arisona, Alexander Erath, Huamin Qu
Journal: Computer Graphics Forum
Publisher: Eurographics Association
Year: 2015
Link: http://dx.doi.org/10.1111/cgf.12778

Revealing Centrality in the Spatial Structure of Cities from Human Activity Patterns (Urban Studies)

Journal: Urban Studies

Authors: Chen Zhong, Markus Schläpfer, Stefan Müller Arisona, Michael Batty, Carlo Ratti, Gerhard Schmitt

Abstract: Identifying changes in the spatial structure of cities is a prerequisite for the development and vali- dation of adequate planning strategies. Nevertheless, current methods of measurement are becoming ever more challenged by the highly diverse and intertwined ways of how people actu- ally make use of urban space. Here, we propose a new quantitative measure for the centrality of locations, taking into account not only the numbers of people attracted to different locations, but also the diversity of the activities they are engaged in. This ‘centrality index’ allows for the identifi- cation of functional urban centres and for a systematic tracking of their relative importance over time, thus contributing to our understanding of polycentricity. We demonstrate the proposed index using travel survey data in Singapore for different years between 1997 and 2012. It is shown that, on the one hand, the city-state has been developing rapidly towards a polycentric urban form that compares rather closely with the official urban development plan. On the other hand, however, the downtown core has strongly gained in its importance, and this can be partly attrib- uted to the recent extension of the public transit system.

Title: Time-Space Diagram Revisited
Authors: Chen Zhong, Markus Schläpfer, Stefan Müller Arisona, Michael Batty, Carlo Ratti, Gerhard Schmitt
Journal: Urban Studies
Publisher: Sage
Year: 2015
Link: https://dx.doi.org/10.1177/0042098015601599

Measuring Variability of Mobility Patterns from Multiday Smart-card Data (JOCS 2015)

Journal: Journal of Computational Science

Authors: Chen Zhong, Ed Manley, Stefan Müller Arisona, Michael Batty, Gerhard Schmitt

Abstract: The availability of large amounts of mobility data has stimulated the research in discovering patterns and understanding regularities. Comparatively, less attention has been paid to the study of variability, which, however, has been argued as equally important as regularities, since variability identifies diversity. In a transport network, variability exists from person to person, from place to place, and from day to day. In this paper, we present a set of measuring of variability at individual and aggregated levels using multi-day smart-card data. Statistical analysis, correlation matrix and network-based clustering methods are applied and potential use of measured results for urban applications are also discussed. We take Singapore as a case study and use one-week smart-card data for analysis. An interesting finding is that though the number of trips and mobility patterns varies from day to day, the overall spatial structure of urban movement always remains the same throughout a week. This finding showed that a systemic framework with well-organized analytical methods is indeed, necessary for extracting variability that may change at different levels and consequently for uncovering different aspects of dynamics, namely transit, social and urban dynamics. We consider this paper as a tentative work toward such generic framework for measuring variability and it can be used as a reference for other research work in such a direction.

Title: Time-Space Diagram Revisited
Authors: Chen Zhong, Ed Manley, Stefan Müller Arisona, Michael Batty, Gerhard Schmitt
Journal: Journal of Computational Science
Publisher: Elsevier
Volume: 9
Year: 2015
Pages: 125 – 130
Link: http://dx.doi.org/10.1016/j.jocs.2015.04.021

Time–Space Diagram Revisited (TRR 2442)

Journal: Transportation Research Record: Journal of the Transportation Research Board.

Authors: Afian Anwar, Zeng Wei, Stefan Müller Arisona

Abstract: Widely used in the design and analysis of transportation systems, time-space diagrams were developed in an era of data scarcity, when it was necessary to obtain data by means of driver logs, human observ- ers, and aerial photographs. This paper shows how time-space diagrams remain relevant today, in an era of data abundance. An application efficiently encodes the trajectories of bus GPS data in a time-space cube and uses simple geometric methods to calculate and to visualize the headways and separation of buses on a bus route. These methods are discussed in detail. How they can be used as the basis of a software package that monitors performance measures for a variety of applications is explored.

Title: Time-Space Diagram Revisited
Authors: Afian Anwar, Wei Zeng, Stefan Müller Arisona
Journal: TRR
Publisher: TRB
Volume: 2442
Year: 2014
Pages: 1 – 7
Link: http://dx.doi.org/10.3141/2442-01

Visualizing Mobility of Public Transportation System (TVCG/VAST)

Journal: IEEE Transactions on Visualization and Computer Graphics (TVCG).

Conference: IEEE Visual Analytics Science and Technology (VAST) 2014.

Authors: Wei Zeng, Chi-Wing Fu, Stefan Müller Arisona, Alexander Erath, Huamin Qu

Abstract: Public transportation systems (PTSs) play an important role in modern cities, providing shared/massive transportation services that are essential for the general public. However, due to their increasing complexity, designing effective methods to visualize and explore PTS is highly challenging. Most existing techniques employ network visualization methods and focus on showing the network topology across stops while ignoring various mobility-related factors such as riding time, transfer time, waiting time, and round-the-clock patterns. This work aims to visualize and explore passenger mobility in a PTS with a family of analytical tasks based on inputs from transportation researchers. After exploring different design alternatives, we come up with an integrated solution with three visualization modules: isochrone map view for geographical information, isotime flow map view for effective temporal information comparison and manipulation, and OD-pair journey view for detailed visual analysis of mobility factors along routes between specific origin-destination pairs. The isotime flow map linearizes a flow map into a parallel isoline representation, maximizing the visualization of mobility information along the horizontal time axis while presenting clear and smooth pathways from origin to destinations. Moreover, we devise several interactive visual query methods for users to easily explore the dynamics of PTS mobility over space and time. Lastly, we also construct a PTS mobility model from millions of real passenger trajectories, and evaluate our visualization techniques with assorted case studies with the transportation researchers.

Title: Visualizing Mobility of Public Transportation System
Authors: Wei Zeng, Chi-Wing Fu, Stefan Müller Arisona, Alexander Erath, Huamin Qu
Journal: IEEE TVCG
Publisher: IEEE
Volume: 20(12)
Year: 2014
Pages: 1833 – 1842
Link: http://dx.doi.org/10.1109/TVCG.2014.2346893

Detecting the Dynamics of Urban Structure Through Spatial Network Analysis (IJGIS 2014)

Journal: International Journal of Geographical Information Science

Authors: Chen Zhong, Stefan Müller Arisona, Xianfeng Huang, Michael Batty, Gerhard Schmitt

Abstract: Urban spatial structure in large cities is becoming ever more complex as populations grow in size, engage in more travel, and have increasing amounts of disposable income that enable them to live more diverse lifestyles. These trends have prominent and visible effects on urban activity, and cities are becoming more polycentric in their structure as new clusters and hotspots emerge and coalesce in a wider sea of urban development. Here, we apply recent methods in network science and their generalization to spatial analysis to identify the spatial structure of city hubs, centers, and borders, which are essential elements in understanding urban interactions. We use a ‘big’ data set for Singapore from the automatic smart card fare collection system, which is available for sample periods in 2010, 2011, and 2012 to show how the changing roles and influences of local areas in the overall spatial structure of urban movement can be efficiently monitored from daily transportation.
In essence, we first construct a weighted directed graph from these travel records. Each node in the graph denotes an urban area, edges denote the possibility of travel between any two areas, and the weight of edges denotes the volume of travel, which is the number of trips made. We then make use of (a) the graph properties to obtain an overall view of travel demand, (b) graph centralities for detecting urban centers and hubs, and (c) graph community structures for uncovering socioeconomic clusters defined as neighborhoods and their borders. Finally, results of this network analysis are projected back onto geographical space to reveal the spatial structure of urban movements. The revealed community structure shows a clear subdivision into different areas that separate the population’s activity space into smaller neighborhoods. The generated borders are different from existing administrative ones. By comparing the results from 3 years of data, we find that Singapore, even from such a short time series, is developing rapidly towards a polycentric urban form, where new subcenters and communities are emerging largely in line with the city’s master plan.
To summarize, our approach yields important insights into urban phenomena generated by human movements. It represents a quantitative approach to urban analysis, which explicitly identifies ongoing urban transformations.

Title: Detecting the Dynamics of Urban Structure Through Spatial Network Analysis
Authors: Chen Zhong, Stefan Müller Arisona, Xianfeng Huang, Michael Batty, Gerhard Schmitt
Journal: International Journal of Geographical Information Science
Publisher: Taylor & Francis
Year: 2014
DOI: 10.1080/13658816.2014.914521
Link: http://www.tandfonline.com/doi/abs/10.1080/13658816.2014.914521#.U8P6N1bsd8E

A Visual Analytics Framework for Large Transportation Datasets (CAADRIA 2014)

Conference: 19th International Conference on Computer-Aided Architectural Design Research in Asia CAADRIA 2014

Authors: Chen Zhong, Stefan Müller Arisona, Gerhard Schmitt

Abstract: The advancement of sensor technologies makes it possible to collect large amounts of dynamic urban data. On the other hand, how to store, process, and analyze collected urban data to make them useful becomes a new challenge. To address this issue, this paper proposes a visual analytics framework, which is applied to transportation data to manage and extract information for urban studies. More specif- ically, the proposed framework has three components: (1) a geographic information system (GIS) based pipeline providing basic data processing functions; (2) a spatial network analysis that is integrated into the pipeline for extracting spatial structure of urban movement; (3) interactive operations allowing the user to explore and view the output data sets at different levels of details. Taking Singapore as a case study area, we use a sample data set from the automatic smart card fare collection system as an input to our prototype tool. The result shows the feasibility of proposed framework and analysis method. To summarize, our work shows the potential of geospatial based visual analytics tools in using ‘big’ data for urban analysis.

Award: Won best presentation award.

Title: A Visual Analytics Framework for Large Transportation Datasets
Authors: Chen Zhong, Stefan Müller Arisona, Gerhard Schmitt
Proceedings: 19th International Conference on Computer- Aided Architectural Design Research in Asia CAADRIA 2014
Publisher: The Association for Computer-Aided Architectural Design Research in Asia (CAADRIA)
Year: 2014
Pages: 223 – 232
Link: http://cumincad.scix.net/cgi-bin/works/Show?caadria2014_014

Multi-Projector-Mapper (MPM): Open-Source 3D Projection Mapping Software Framework

The multi-projector-mapper (MPM) is an open-source software framework for 3D projection mapping using multiple projectors. It contains a basic rendering infrastructure, and interactive tools for projector calibration. For calibration, the method given in Oliver Bimber and Ramesh Raskar’s book Spatial Augmented Reality, Appendix A, is used. Continue reading