Tag Archives: Urban Modeling

CityEngine 3D Building Models of Berlin Mitte

This github project contains a Esri CityEngine model with ground plane, streets, parcels and 3D models of Berlin Mitte (2x2km) based on the open data provided by Berlin’s Senatsverwaltung für Stadtentwicklung und Wohnen (https://www.stadtentwicklung.berlin.de/).

According to the copyright of the source data (see link above) you may use and modify this project as you like, but commercial use is prohibited.

The CityEngine project was originally created for a participatory urban planning application “Enabling DEMO:POLIS”, exhibited at the Berlin Academy of Arts in 2016. The source code for the application is available freely as well (see https://robotized.arisona.ch/enabling-demopolis/ for more information).

Compared to the source data, the 3D models in the CityEngine project have been cleaned up with great care (removing duplicate faces, fixing normals, merging vertices etc.). Thus, the model can easily be used for visualization, urban planning scenarios, etc.

Available at github: https://github.com/arisona/berlin_3d

Revealing Centrality in the Spatial Structure of Cities from Human Activity Patterns (Urban Studies)

Journal: Urban Studies

Authors: Chen Zhong, Markus Schläpfer, Stefan Müller Arisona, Michael Batty, Carlo Ratti, Gerhard Schmitt

Abstract: Identifying changes in the spatial structure of cities is a prerequisite for the development and vali- dation of adequate planning strategies. Nevertheless, current methods of measurement are becoming ever more challenged by the highly diverse and intertwined ways of how people actu- ally make use of urban space. Here, we propose a new quantitative measure for the centrality of locations, taking into account not only the numbers of people attracted to different locations, but also the diversity of the activities they are engaged in. This ‘centrality index’ allows for the identifi- cation of functional urban centres and for a systematic tracking of their relative importance over time, thus contributing to our understanding of polycentricity. We demonstrate the proposed index using travel survey data in Singapore for different years between 1997 and 2012. It is shown that, on the one hand, the city-state has been developing rapidly towards a polycentric urban form that compares rather closely with the official urban development plan. On the other hand, however, the downtown core has strongly gained in its importance, and this can be partly attrib- uted to the recent extension of the public transit system.

Title: Time-Space Diagram Revisited
Authors: Chen Zhong, Markus Schläpfer, Stefan Müller Arisona, Michael Batty, Carlo Ratti, Gerhard Schmitt
Journal: Urban Studies
Publisher: Sage
Year: 2015
Link: https://dx.doi.org/10.1177/0042098015601599

Measuring Variability of Mobility Patterns from Multiday Smart-card Data (JOCS 2015)

Journal: Journal of Computational Science

Authors: Chen Zhong, Ed Manley, Stefan Müller Arisona, Michael Batty, Gerhard Schmitt

Abstract: The availability of large amounts of mobility data has stimulated the research in discovering patterns and understanding regularities. Comparatively, less attention has been paid to the study of variability, which, however, has been argued as equally important as regularities, since variability identifies diversity. In a transport network, variability exists from person to person, from place to place, and from day to day. In this paper, we present a set of measuring of variability at individual and aggregated levels using multi-day smart-card data. Statistical analysis, correlation matrix and network-based clustering methods are applied and potential use of measured results for urban applications are also discussed. We take Singapore as a case study and use one-week smart-card data for analysis. An interesting finding is that though the number of trips and mobility patterns varies from day to day, the overall spatial structure of urban movement always remains the same throughout a week. This finding showed that a systemic framework with well-organized analytical methods is indeed, necessary for extracting variability that may change at different levels and consequently for uncovering different aspects of dynamics, namely transit, social and urban dynamics. We consider this paper as a tentative work toward such generic framework for measuring variability and it can be used as a reference for other research work in such a direction.

Title: Time-Space Diagram Revisited
Authors: Chen Zhong, Ed Manley, Stefan Müller Arisona, Michael Batty, Gerhard Schmitt
Journal: Journal of Computational Science
Publisher: Elsevier
Volume: 9
Year: 2015
Pages: 125 – 130
Link: http://dx.doi.org/10.1016/j.jocs.2015.04.021

Detecting the Dynamics of Urban Structure Through Spatial Network Analysis (IJGIS 2014)

Journal: International Journal of Geographical Information Science

Authors: Chen Zhong, Stefan Müller Arisona, Xianfeng Huang, Michael Batty, Gerhard Schmitt

Abstract: Urban spatial structure in large cities is becoming ever more complex as populations grow in size, engage in more travel, and have increasing amounts of disposable income that enable them to live more diverse lifestyles. These trends have prominent and visible effects on urban activity, and cities are becoming more polycentric in their structure as new clusters and hotspots emerge and coalesce in a wider sea of urban development. Here, we apply recent methods in network science and their generalization to spatial analysis to identify the spatial structure of city hubs, centers, and borders, which are essential elements in understanding urban interactions. We use a ‘big’ data set for Singapore from the automatic smart card fare collection system, which is available for sample periods in 2010, 2011, and 2012 to show how the changing roles and influences of local areas in the overall spatial structure of urban movement can be efficiently monitored from daily transportation.
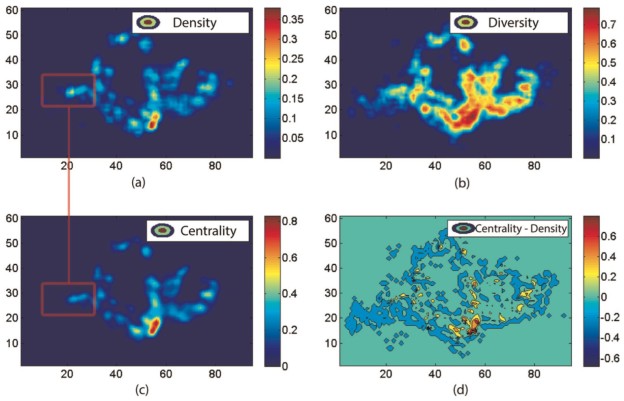
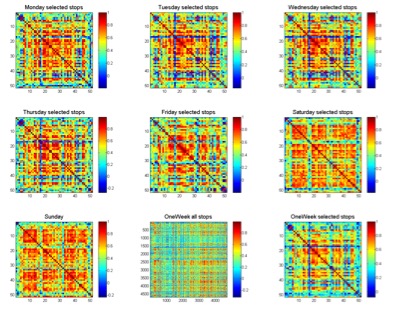
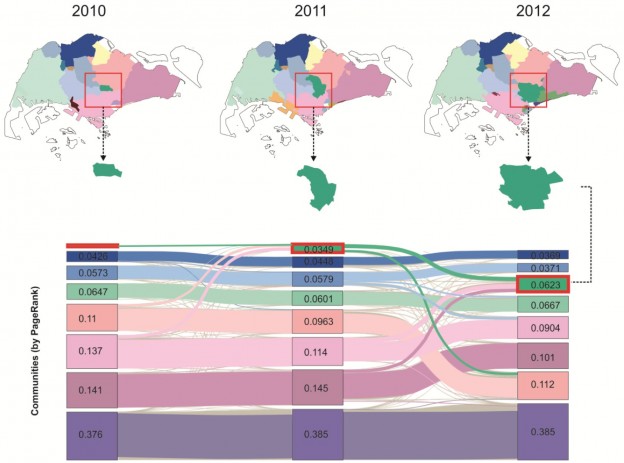
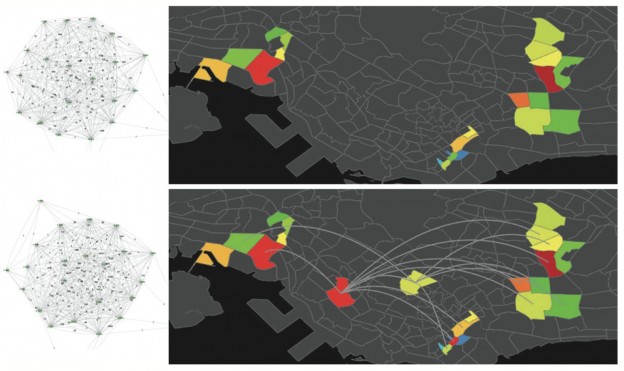
In essence, we first construct a weighted directed graph from these travel records. Each node in the graph denotes an urban area, edges denote the possibility of travel between any two areas, and the weight of edges denotes the volume of travel, which is the number of trips made. We then make use of (a) the graph properties to obtain an overall view of travel demand, (b) graph centralities for detecting urban centers and hubs, and (c) graph community structures for uncovering socioeconomic clusters defined as neighborhoods and their borders. Finally, results of this network analysis are projected back onto geographical space to reveal the spatial structure of urban movements. The revealed community structure shows a clear subdivision into different areas that separate the population’s activity space into smaller neighborhoods. The generated borders are different from existing administrative ones. By comparing the results from 3 years of data, we find that Singapore, even from such a short time series, is developing rapidly towards a polycentric urban form, where new subcenters and communities are emerging largely in line with the city’s master plan.
To summarize, our approach yields important insights into urban phenomena generated by human movements. It represents a quantitative approach to urban analysis, which explicitly identifies ongoing urban transformations.

Title: Detecting the Dynamics of Urban Structure Through Spatial Network Analysis
Authors: Chen Zhong, Stefan Müller Arisona, Xianfeng Huang, Michael Batty, Gerhard Schmitt
Journal: International Journal of Geographical Information Science
Publisher: Taylor & Francis
Year: 2014
DOI: 10.1080/13658816.2014.914521
Link: http://www.tandfonline.com/doi/abs/10.1080/13658816.2014.914521#.U8P6N1bsd8E

A Visual Analytics Framework for Large Transportation Datasets (CAADRIA 2014)

Conference: 19th International Conference on Computer-Aided Architectural Design Research in Asia CAADRIA 2014

Authors: Chen Zhong, Stefan Müller Arisona, Gerhard Schmitt

Abstract: The advancement of sensor technologies makes it possible to collect large amounts of dynamic urban data. On the other hand, how to store, process, and analyze collected urban data to make them useful becomes a new challenge. To address this issue, this paper proposes a visual analytics framework, which is applied to transportation data to manage and extract information for urban studies. More specif- ically, the proposed framework has three components: (1) a geographic information system (GIS) based pipeline providing basic data processing functions; (2) a spatial network analysis that is integrated into the pipeline for extracting spatial structure of urban movement; (3) interactive operations allowing the user to explore and view the output data sets at different levels of details. Taking Singapore as a case study area, we use a sample data set from the automatic smart card fare collection system as an input to our prototype tool. The result shows the feasibility of proposed framework and analysis method. To summarize, our work shows the potential of geospatial based visual analytics tools in using ‘big’ data for urban analysis.

Award: Won best presentation award.

Title: A Visual Analytics Framework for Large Transportation Datasets
Authors: Chen Zhong, Stefan Müller Arisona, Gerhard Schmitt
Proceedings: 19th International Conference on Computer- Aided Architectural Design Research in Asia CAADRIA 2014
Publisher: The Association for Computer-Aided Architectural Design Research in Asia (CAADRIA)
Year: 2014
Pages: 223 – 232
Link: http://cumincad.scix.net/cgi-bin/works/Show?caadria2014_014

smartgeometry/sg13: Constructing for Uncertainty

Good news to start the year with: Our cluster proposal “Projections of Reality” has been accepted for this year’s smartgeometry at The Bartlett of UCL from 15 – 20 April 2013 in London. Cluster gurus: Stefan Müller Arisona, Eva Friedrich, Bruno Moser, Dominik Nuessen, Lukas Treyer. Continue reading

Book: Digital Urban Modeling and Simulation

Edited by Stefan Müller Arisona, Gideon Aschwanden, Jan Halatsch, and Peter Wonka, 2012

About this Book

This book is thematically positioned at the intersections of Urban Design, Architecture, Civil Engineering and Computer Science, and it has the goal to provide specialists coming from respective fields a multi-angle overview of state-of-the-art work currently being carried out. It addresses both newcomers who wish to obtain more knowledge about this growing area of interest, as well as established researchers and practitioners who want to keep up to date. In terms of organization, the volume starts out with chapters looking at the domain at a wide-angle and then moves focus towards technical viewpoints and approaches. (Excerpt from preface by Stefan Müller Arisona). Continue reading

Esri CityEngine – 3D City Modeling for Architecture, Film, and Games

Esri CityEngine, is a 3D modeling software application developed by Esri R&D Center Zurich (formerly Procedural Inc.) and is specialized in the generation of three dimensional urban environments. With the procedural modeling approach, CityEngine enables the efficient creation of detailed large-scale 3D city models with merely a few clicks of the mouse instead of the time exhaustive & work intensive method of object creation & manual placement. CityEngine works with architectural object placement & arrangement in the same manner that VUE manages terrain, ecosystems & atmosphere mapping & is equally as diverse in its ability of object manipulation & environmantal conformity/harmony as its VUE counterpart. The recent acquisition of CityEngine by Esri is aiming to push the innovations in 3D GIS and Geodesign technology (from Wikipedia). Continue reading