Tag Archives: Visualization

Visualizing Interchange Patterns in Massive Movement Data (EuroVis 2013)

Authors: Wei Zeng, Chi-Wing Fu, Stefan Müller Arisona, Huamin Qu

circos_multiscale

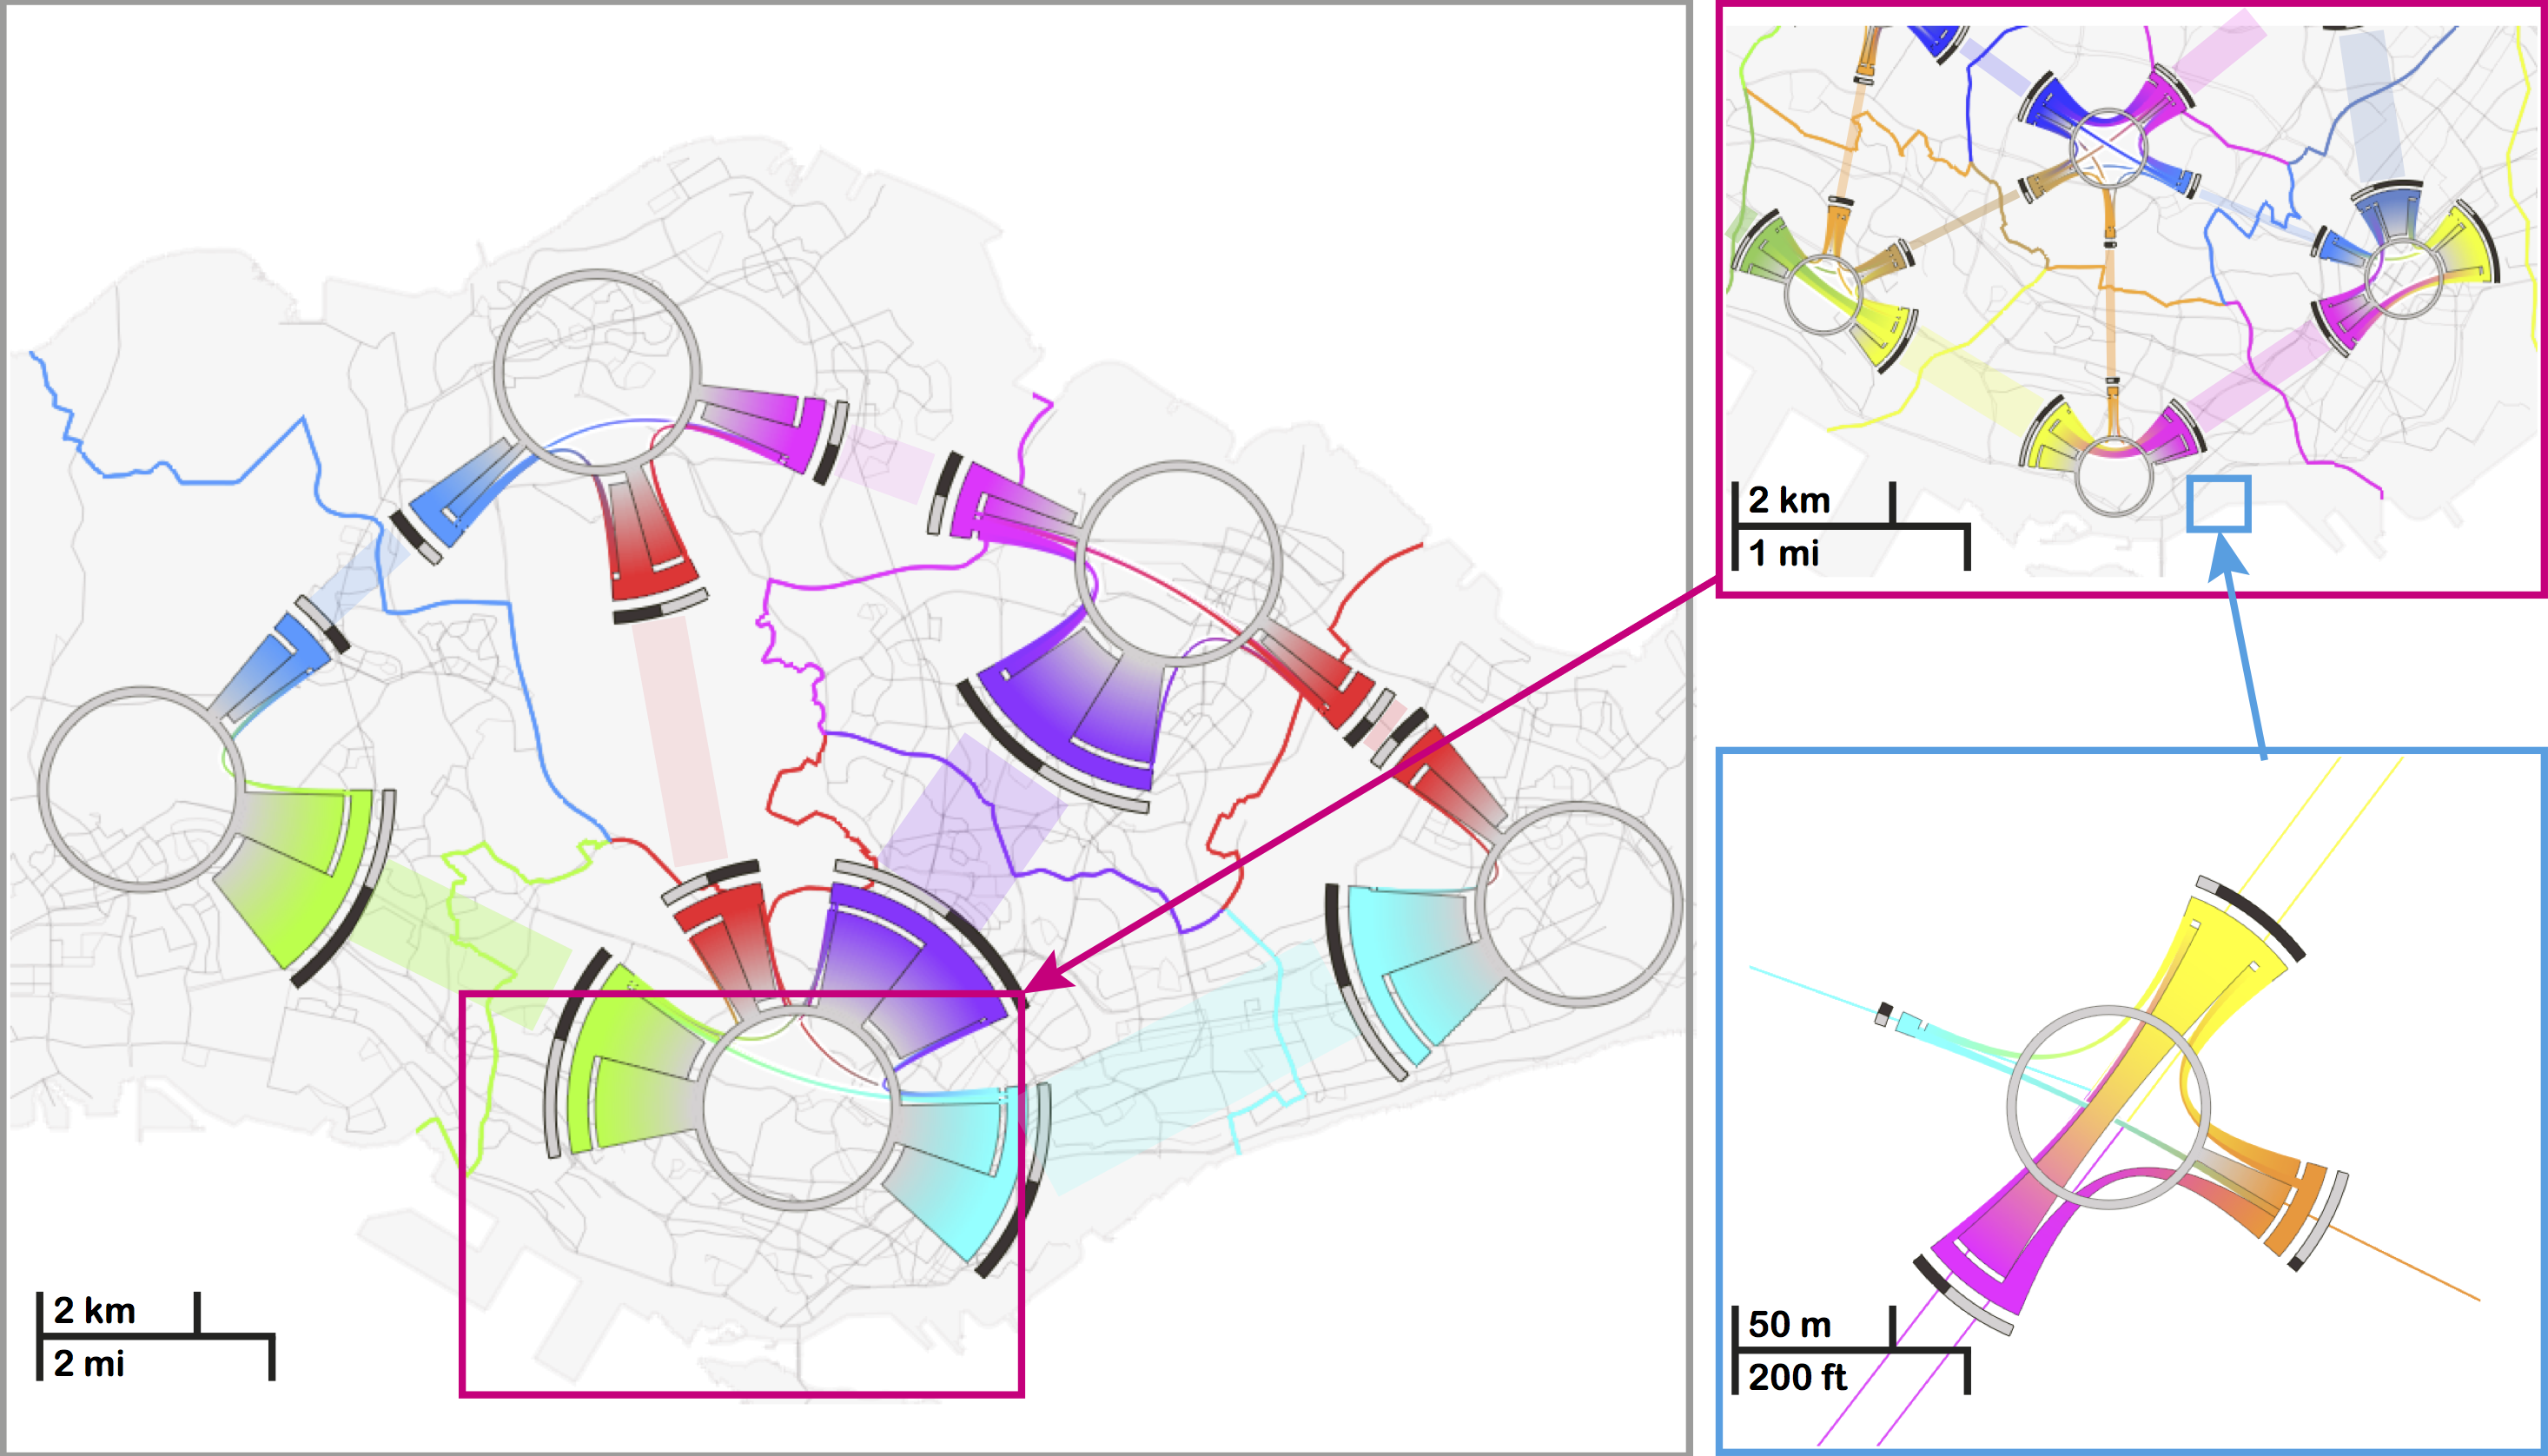
Abstract: Massive amount of movement data, such as daily trips made by millions of passengers in a city, are widely avail- able nowadays. They are a highly valuable means not only for unveiling human mobility patterns, but also for assisting transportation planning, in particular for metropolises around the world. In this paper, we focus on a novel aspect of visualizing and analyzing massive movement data, i.e., the interchange pattern, aiming at re- vealing passenger redistribution in a traffic network. We first formulate a new model of circos figure, namely the interchange circos diagram, to present interchange patterns at a junction node in a bundled fashion, and optimize the color assignments to respect the connections within and between junction nodes. Based on this, we develop a family of visual analysis techniques to help users interactively study interchange patterns in a spatiotemporal manner: 1) multi-spatial scales: from network junctions such as train stations to people flow across and between larger spatial areas; and 2) temporal changes of patterns from different times of the day. Our techniques have been applied to real movement data consisting of hundred thousands of trips, and we present also two case studies on how transportation experts worked with our interface.

Title: Visualizing Interchange Patterns in Massive Movement Data
Authors: Wei Zeng, Chi-Wing Fu, Stefan Müller Arisona, Huamin Qu
Journal: Computer Graphics Forum
Publisher: Wiley
Year: 2013
Volume: 32(3)
Pages: 271-280
DOI: 10.1111/cgf.12114
Link: http://onlinelibrary.wiley.com/doi/10.1111/cgf.12114/abstract

smartgeometry/sg13: Constructing for Uncertainty

Good news to start the year with: Our cluster proposal “Projections of Reality” has been accepted for this year’s smartgeometry at The Bartlett of UCL from 15 – 20 April 2013 in London. Cluster gurus: Stefan Müller Arisona, Eva Friedrich, Bruno Moser, Dominik Nuessen, Lukas Treyer. Continue reading

Addis2050: Visualizing Future Energy Scenarios

The energy scenario planning tool, developed by Eva Friedrich, has been presented at the ADDIS 2050 conference in Addis Ababa on October 9th and 10th 2012. The basic concept of the work is to create an intuitive and playful tool that allows for collaborative, interactive exploration of possible energy supply and consumption scenarios in Ethiopia. Continue reading

Book: Digital Urban Modeling and Simulation

Edited by Stefan Müller Arisona, Gideon Aschwanden, Jan Halatsch, and Peter Wonka, 2012

About this Book

This book is thematically positioned at the intersections of Urban Design, Architecture, Civil Engineering and Computer Science, and it has the goal to provide specialists coming from respective fields a multi-angle overview of state-of-the-art work currently being carried out. It addresses both newcomers who wish to obtain more knowledge about this growing area of interest, as well as established researchers and practitioners who want to keep up to date. In terms of organization, the volume starts out with chapters looking at the domain at a wide-angle and then moves focus towards technical viewpoints and approaches. (Excerpt from preface by Stefan Müller Arisona). Continue reading

The Value Lab Asia

The Value Lab Asia is a collaborative, digitally augmented environment for a wide range of applications, such as participatory urban planning and design, stakeholder communication, information visualisation and discovery, remote teaching and conferencing. It includes a 33 megapixel video wall, three large displays with touch overlays, a number of smaller, mobile multi-touch enabled displays, and extensive video conferencing capabilities. The Value Lab Asia is the younger sibling of the Value Lab Zurich, built at ETH Zurich’s ScienceCity by Gerhard Schmitt, Remo Burkhard, Jan Halatsch and Antje Kunze of the Chair of Information Architecture in 2007/08. It therefore borrows many of the concepts of the Value Lab Zurich, such as being set in a friendly environment that operates in daylight conditions, however comes with updated state-of-the-art hardware and a different look. Continue reading

MetroBuzz: Interactive Visualization of Urban Transportation Data

Agent based simulation tools such as MATSim and MITSIM allow us to achieve efficient and accurate predictions of crowd behavior, thereby increasing our understanding of urban systems and assist in urban planning. However, output produced by such simulation platforms are difficult to communicate to stakeholders such as government agencies and the general public due to their technical nature. Continue reading