Category Archives: Software

CityEngine 3D Building Models of Berlin Mitte

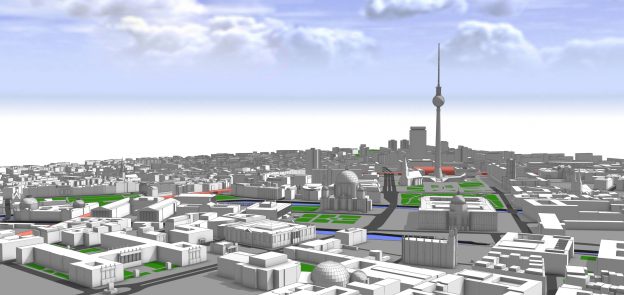
This github project contains a Esri CityEngine model with ground plane, streets, parcels and 3D models of Berlin Mitte (2x2km) based on the open data provided by Berlin’s Senatsverwaltung für Stadtentwicklung und Wohnen (https://www.stadtentwicklung.berlin.de/).

According to the copyright of the source data (see link above) you may use and modify this project as you like, but commercial use is prohibited.

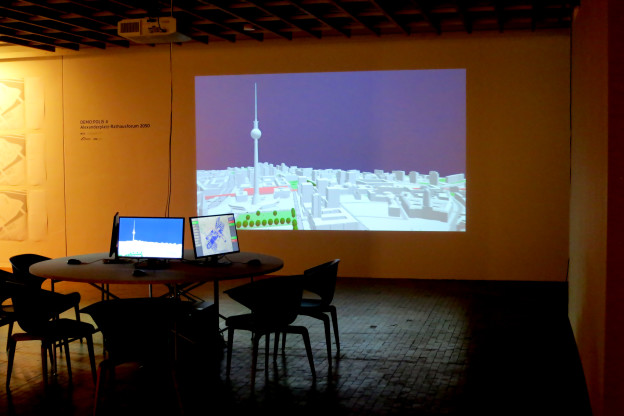
The CityEngine project was originally created for a participatory urban planning application “Enabling DEMO:POLIS”, exhibited at the Berlin Academy of Arts in 2016. The source code for the application is available freely as well (see https://robotized.arisona.ch/enabling-demopolis/ for more information).

Compared to the source data, the 3D models in the CityEngine project have been cleaned up with great care (removing duplicate faces, fixing normals, merging vertices etc.). Thus, the model can easily be used for visualization, urban planning scenarios, etc.

Available at github: https://github.com/arisona/berlin_3d

Enabling DEMO:POLIS

“Enabling DEMO:POLIS” is a participatory urban planning installation, presented as part of the DEMO:POLIS exhibition at the Berlin Akademie der Künste (http://www.adk.de/demopolis – 11.3.2016 – 29.5.2016). The installation engages the public in the design of open space and consists of six terminals that run a custom, interactive software application.

The software leads the user through a number of typical urban design tools (space allocation, streets, buildings, landscape, etc.) and concludes with a fly-through through the generated 3D scenario, in this case, the Rathausforum / Alexanderplatz area in Berlin.

The following video demonstrates a full cycle of a possible design.

Contact

Stefan Arisona – https://robotized.arisona.ch

Open Source

Source code, data and a binary build are available at: http://github.com/arisona

Credits

Concept: Stefan Arisona, Ruth Conroy Dalton, Christoph Hölscher, Wilfried Wang

Data & Coding: Stefan Arisona, Simon Schubiger, Zeng Wei

Support: Akademie der Künste Berlin, FHNW Switzerland (Institute of 4D Technologies), ETH Zürich (Future Cities Laboratory and Chair of Cognitive Science), Northumbria University (Architecture and Built Environment).

Data & Software Workflow

Enabling DEMO:POLIS builds on Open Data, in particular the publicly available 3D models of central Berlin provided by the Staatssenat für Stadtentwicklung und Umwelt (http://www.stadtentwicklung.berlin.de/planen/stadtmodelle/)

The original 3D models were initially imported into Autodesk AutoCAD for layer selection and coordinate system adjustments, then imported into Autodesk Maya for data cleaning and corrections. In a final step the data was imported into Esri CityEngine for final data adjustments & cleaning, merging, labelling, etc. The data was then exported as OBJs. The software application is written in Java, based on the 3D graphics library/engine ether. As indicated above, all source code and data is available as open source.

RMX Tempo Adjust (Max for Live Utility)

I quickly coded a small utility for Ableton Live that allows mapping of controller buttons / keyboard keys to increment / decrement tempo. There are other ways to achieve this (e.g. https://www.ableton.com/en/articles/tempo-mapping-buttons/), however for those with M4L this seems easier and more flexible. It’s obviously not very generic, but can easily be modified to increment / decrement other live parameters in a similar way. Just drop it on an empty MIDI track and map the two buttons.

Download it for free here: http://www.maxforlive.com/library/device/2986/rmx-tempo-adjust

Time–Space Diagram Revisited (TRR 2442)

Journal: Transportation Research Record: Journal of the Transportation Research Board.

Authors: Afian Anwar, Zeng Wei, Stefan Müller Arisona

Abstract: Widely used in the design and analysis of transportation systems, time-space diagrams were developed in an era of data scarcity, when it was necessary to obtain data by means of driver logs, human observ- ers, and aerial photographs. This paper shows how time-space diagrams remain relevant today, in an era of data abundance. An application efficiently encodes the trajectories of bus GPS data in a time-space cube and uses simple geometric methods to calculate and to visualize the headways and separation of buses on a bus route. These methods are discussed in detail. How they can be used as the basis of a software package that monitors performance measures for a variety of applications is explored.

Title: Time-Space Diagram Revisited
Authors: Afian Anwar, Wei Zeng, Stefan Müller Arisona
Journal: TRR
Publisher: TRB
Volume: 2442
Year: 2014
Pages: 1 – 7
Link: http://dx.doi.org/10.3141/2442-01

Visualizing Mobility of Public Transportation System (TVCG/VAST)

Journal: IEEE Transactions on Visualization and Computer Graphics (TVCG).

Conference: IEEE Visual Analytics Science and Technology (VAST) 2014.

Authors: Wei Zeng, Chi-Wing Fu, Stefan Müller Arisona, Alexander Erath, Huamin Qu

Abstract: Public transportation systems (PTSs) play an important role in modern cities, providing shared/massive transportation services that are essential for the general public. However, due to their increasing complexity, designing effective methods to visualize and explore PTS is highly challenging. Most existing techniques employ network visualization methods and focus on showing the network topology across stops while ignoring various mobility-related factors such as riding time, transfer time, waiting time, and round-the-clock patterns. This work aims to visualize and explore passenger mobility in a PTS with a family of analytical tasks based on inputs from transportation researchers. After exploring different design alternatives, we come up with an integrated solution with three visualization modules: isochrone map view for geographical information, isotime flow map view for effective temporal information comparison and manipulation, and OD-pair journey view for detailed visual analysis of mobility factors along routes between specific origin-destination pairs. The isotime flow map linearizes a flow map into a parallel isoline representation, maximizing the visualization of mobility information along the horizontal time axis while presenting clear and smooth pathways from origin to destinations. Moreover, we devise several interactive visual query methods for users to easily explore the dynamics of PTS mobility over space and time. Lastly, we also construct a PTS mobility model from millions of real passenger trajectories, and evaluate our visualization techniques with assorted case studies with the transportation researchers.

Title: Visualizing Mobility of Public Transportation System
Authors: Wei Zeng, Chi-Wing Fu, Stefan Müller Arisona, Alexander Erath, Huamin Qu
Journal: IEEE TVCG
Publisher: IEEE
Volume: 20(12)
Year: 2014
Pages: 1833 – 1842
Link: http://dx.doi.org/10.1109/TVCG.2014.2346893

A Visual Analytics Framework for Large Transportation Datasets (CAADRIA 2014)

Conference: 19th International Conference on Computer-Aided Architectural Design Research in Asia CAADRIA 2014

Authors: Chen Zhong, Stefan Müller Arisona, Gerhard Schmitt

Abstract: The advancement of sensor technologies makes it possible to collect large amounts of dynamic urban data. On the other hand, how to store, process, and analyze collected urban data to make them useful becomes a new challenge. To address this issue, this paper proposes a visual analytics framework, which is applied to transportation data to manage and extract information for urban studies. More specif- ically, the proposed framework has three components: (1) a geographic information system (GIS) based pipeline providing basic data processing functions; (2) a spatial network analysis that is integrated into the pipeline for extracting spatial structure of urban movement; (3) interactive operations allowing the user to explore and view the output data sets at different levels of details. Taking Singapore as a case study area, we use a sample data set from the automatic smart card fare collection system as an input to our prototype tool. The result shows the feasibility of proposed framework and analysis method. To summarize, our work shows the potential of geospatial based visual analytics tools in using ‘big’ data for urban analysis.

Award: Won best presentation award.

Title: A Visual Analytics Framework for Large Transportation Datasets
Authors: Chen Zhong, Stefan Müller Arisona, Gerhard Schmitt
Proceedings: 19th International Conference on Computer- Aided Architectural Design Research in Asia CAADRIA 2014
Publisher: The Association for Computer-Aided Architectural Design Research in Asia (CAADRIA)
Year: 2014
Pages: 223 – 232
Link: http://cumincad.scix.net/cgi-bin/works/Show?caadria2014_014

Cinder Deferred Renderer

Cinder application for deferred rendering experiments (lighing, shadow mapping, SSAO), available on Github at https://github.com/arisona/cinder_deferred_renderer

Forked from original code by Anthony Scavarelli anthony.scavarelli@gmail.com at https://github.com/PlumCantaloupe/Cinder-Deferred-Renderer

Thanks to Anthony and the contributors his code is based on.

Original code ported to c++11 and optimized / fixed a couple of things, plus some new features/controls.

This code is based on a deferred renderer for point lights and screen space ambient occlusion (SSAO), including shadow mapping.

Lecture notes on Deferred Rendering and Shadows

In relation to above example code, the following lecture notes are available for download here:

Deferred Rendering (deferred_rendering_131113.pdf)
Shadow Rendering (shadow_rendering_131113.pdf)

Multi-Projector-Mapper (MPM): Open-Source 3D Projection Mapping Software Framework

The multi-projector-mapper (MPM) is an open-source software framework for 3D projection mapping using multiple projectors. It contains a basic rendering infrastructure, and interactive tools for projector calibration. For calibration, the method given in Oliver Bimber and Ramesh Raskar’s book Spatial Augmented Reality, Appendix A, is used. Continue reading

Visualizing Interchange Patterns in Massive Movement Data (EuroVis 2013)

Authors: Wei Zeng, Chi-Wing Fu, Stefan Müller Arisona, Huamin Qu

circos_multiscale

Abstract: Massive amount of movement data, such as daily trips made by millions of passengers in a city, are widely avail- able nowadays. They are a highly valuable means not only for unveiling human mobility patterns, but also for assisting transportation planning, in particular for metropolises around the world. In this paper, we focus on a novel aspect of visualizing and analyzing massive movement data, i.e., the interchange pattern, aiming at re- vealing passenger redistribution in a traffic network. We first formulate a new model of circos figure, namely the interchange circos diagram, to present interchange patterns at a junction node in a bundled fashion, and optimize the color assignments to respect the connections within and between junction nodes. Based on this, we develop a family of visual analysis techniques to help users interactively study interchange patterns in a spatiotemporal manner: 1) multi-spatial scales: from network junctions such as train stations to people flow across and between larger spatial areas; and 2) temporal changes of patterns from different times of the day. Our techniques have been applied to real movement data consisting of hundred thousands of trips, and we present also two case studies on how transportation experts worked with our interface.

Title: Visualizing Interchange Patterns in Massive Movement Data
Authors: Wei Zeng, Chi-Wing Fu, Stefan Müller Arisona, Huamin Qu
Journal: Computer Graphics Forum
Publisher: Wiley
Year: 2013
Volume: 32(3)
Pages: 271-280
DOI: 10.1111/cgf.12114
Link: http://onlinelibrary.wiley.com/doi/10.1111/cgf.12114/abstract